Why You’re Losing with a 60% Win Rate | The Pitfalls of Ignoring R-Multiple and Drawdown
"I have a 60% win rate, so why is my account balance decreasing?"
In discretionary FX trading, many traders eventually hit this wall of confusion.
In reality, a 60% win rate is by no means a bad number. And yet, you can still lose money—and lose it quickly.
The reason lies in the "hidden numbers" beyond the win rate.
First, to determine your win rate, you need proper verification tools. Below is an article summarizing free tools available. If you haven't started backtesting yet, check this out.

The Reality of Failing Discretionary Trades Despite High Win Rates
Win Rate is Only a "Piece of the Puzzle"
Win rate is simply "Number of Wins ÷ Total Number of Trades."
It contains absolutely no information regarding:
- How much you won
- How much you lost
- How much your capital is depleted in a single streak
Despite this, discretionary trading often overemphasizes win rate alone.
Why It "Feels" Like You're Winning
With a 60% win rate, it’s common to:
- Experience winning streaks
- See positive results on a daily or weekly basis
This creates a dangerous psychological trap:
- "I think this method is working."
- "This style suits me."
However, this feeling is rarely backed by actual statistical data.
Reason 1: A Broken R-Multiple (Risk-to-Reward)
The Imbalance Between Wins and Losses
A classic pattern in discretionary trading is:
- Cutting profits short for "peace of mind."
- Letting losses run, hoping the market will "come back."
This results in a distorted R-multiple structure:
- Win: +0.3R
- Loss: -1.0R to -2.0R
How Positive Win Rates Lead to Negative Expectancy
Suppose you have:
- Win Rate: 60%
- Average Win: +0.3R
- Average Loss: -1.0R
Your expectancy would be:
0.6 × 0.3 − 0.4 × 1.0 = -0.22R
Even with a high win rate, your expectancy is negative.
Is a high win rate with positive expectancy enough to be "perfect"? I explain the traps hidden in those numbers in the article below.
The "Win Small, Lose Big" Phenomenon
In discretionary trading, human psychology often intervenes:
- Profits are locked in early to satisfy the need for certainty.
- Losses are held onto as anxiety increases.
The result is a trade structure that is mathematically designed to lose, regardless of how high the win rate is.
Reason 2: Ignoring Maximum Drawdown (MDD)
What Most Discretionary Traders Miss
Most traders remember:
- How much they are currently up.
- How many consecutive wins they just had.
But almost none of them know:
- The maximum percentage their capital has dropped (MDD).
- How frequently those drops occur.
Drawdowns Break Your Mental Game and Position Sizing
When you don't anticipate Drawdowns (DD):
- Capital decreases more than expected.
- You lower your lot size out of fear.
- You miss the recovery phase that follows.
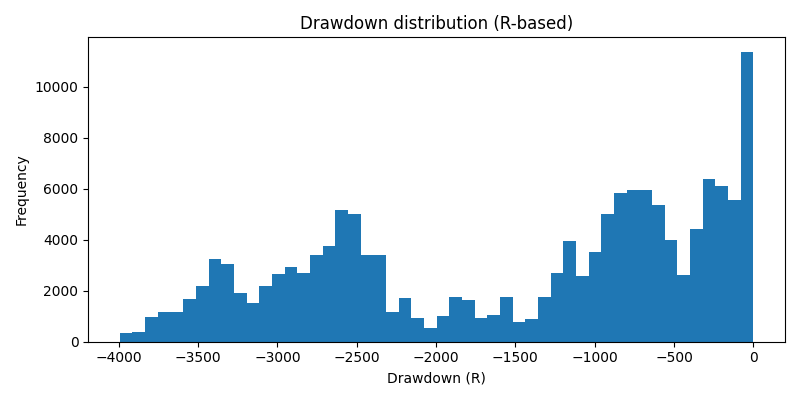
Drawdowns are not the exception; they are a statistical certainty. A DD deeper than you imagined will eventually visit you.
As a result:
- Performance becomes even more unstable.
- You start feeling like you're "just having bad luck lately."
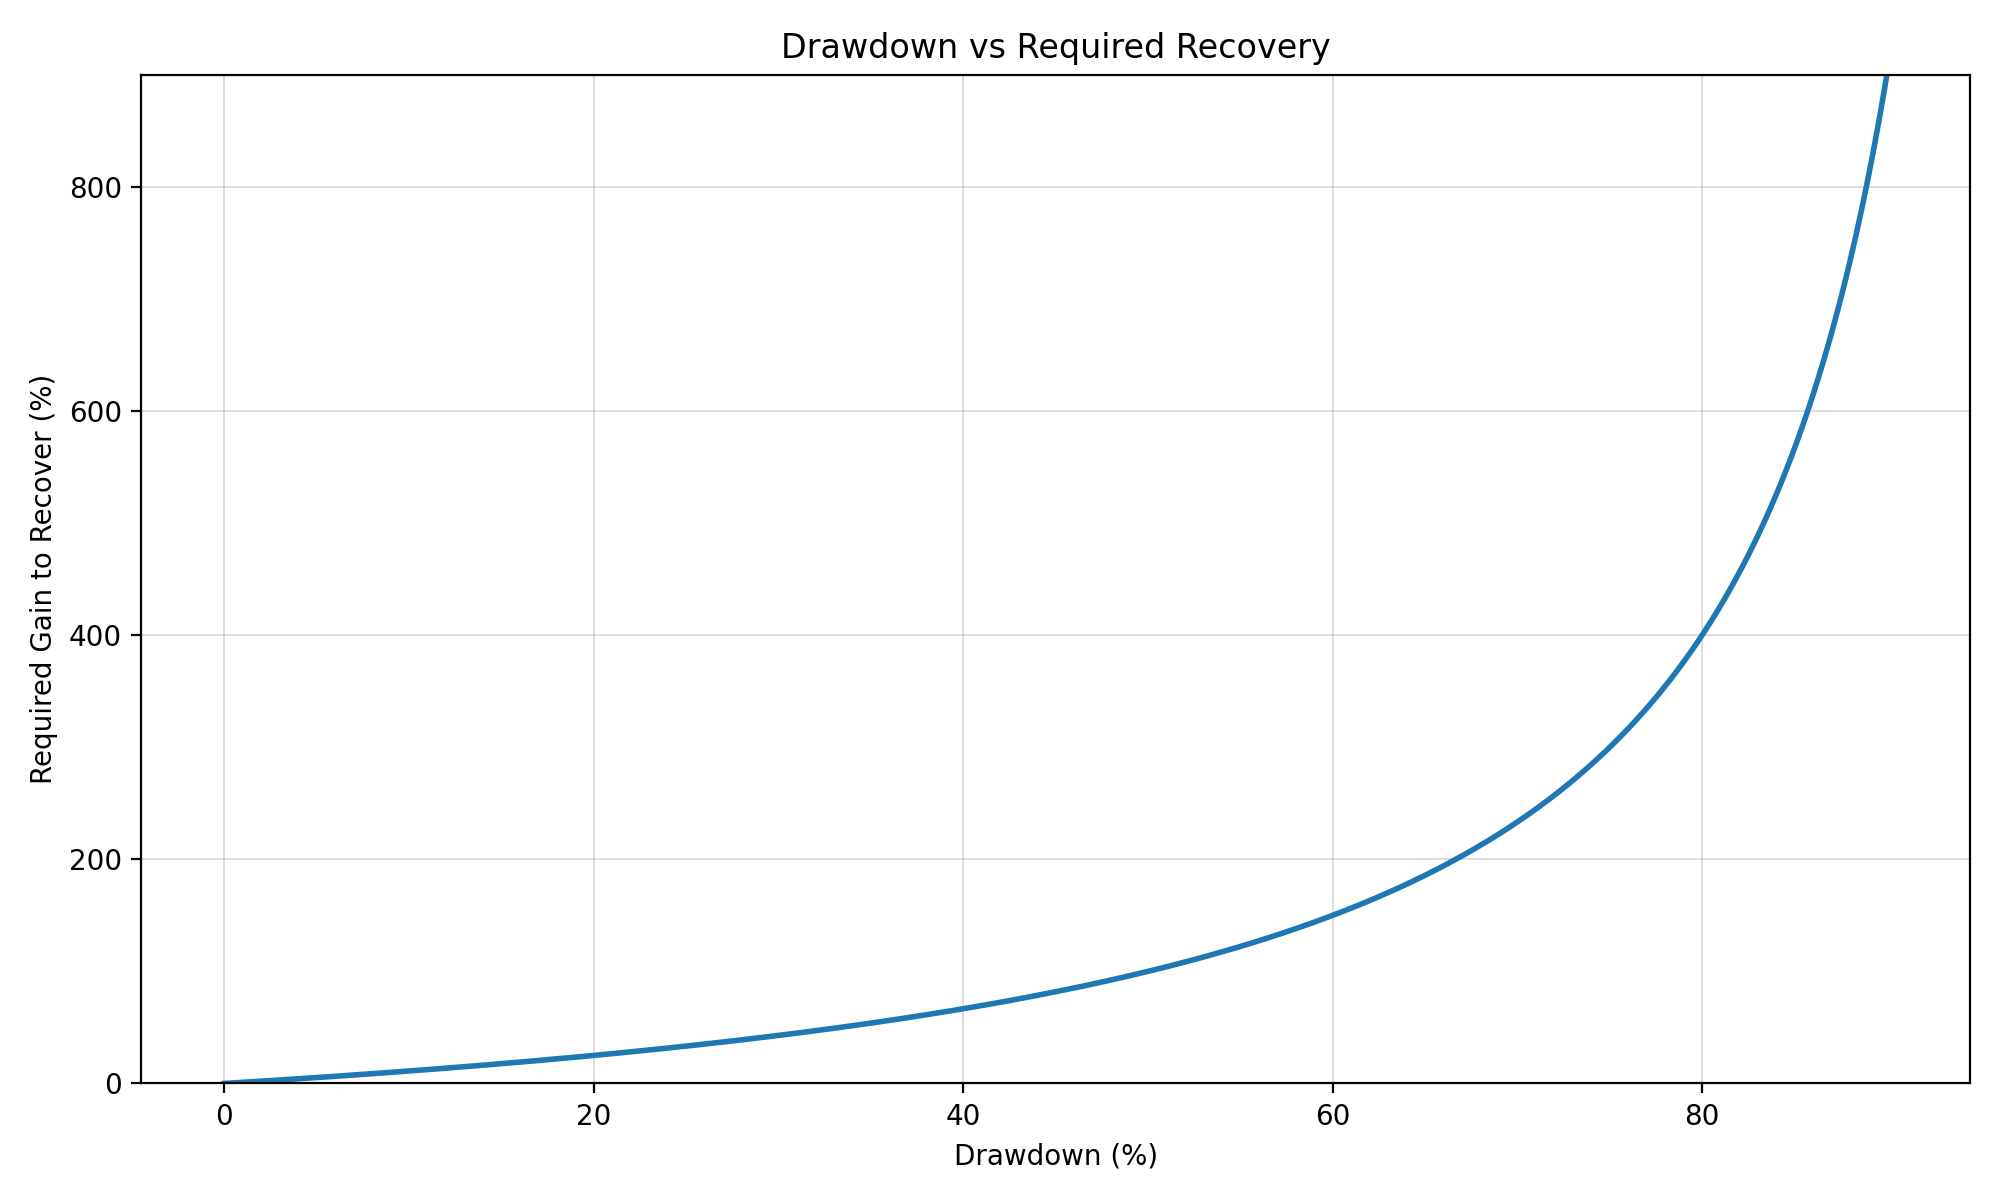
The Illusion of "High Win Rate = Safe"
A 60% win rate looks safe.
In reality, without knowing the depth and frequency of DD, you cannot judge if a strategy is truly safe.
A high win rate does not automatically mean a shallow drawdown. Even with over 60% wins, catastrophic drawdowns are common.
Reason 3: Win Rates Flux, While R-Multiple and DD Accumulate
Win Rates Fluctuate in the Short Term
Win rates vary wildly depending on:
- Sample size (number of trades).
- Market environment.
It is not uncommon for a 60% win rate to drop below 50% without warning.
DD Compounds Over Time
Conversely:
- Distorted R-multiples
- Depth of Drawdown
These factors inevitably take their toll as you increase your trade count. They might be hidden in the short term, but they always surface in the long run.
The Typical Downfall of Discretionary Trading
- High win rate.
- Stagnant capital.
- Mental exhaustion.
This leads to the "Discretionary Dead End": switching strategies constantly or fluctuating lot sizes in desperation.
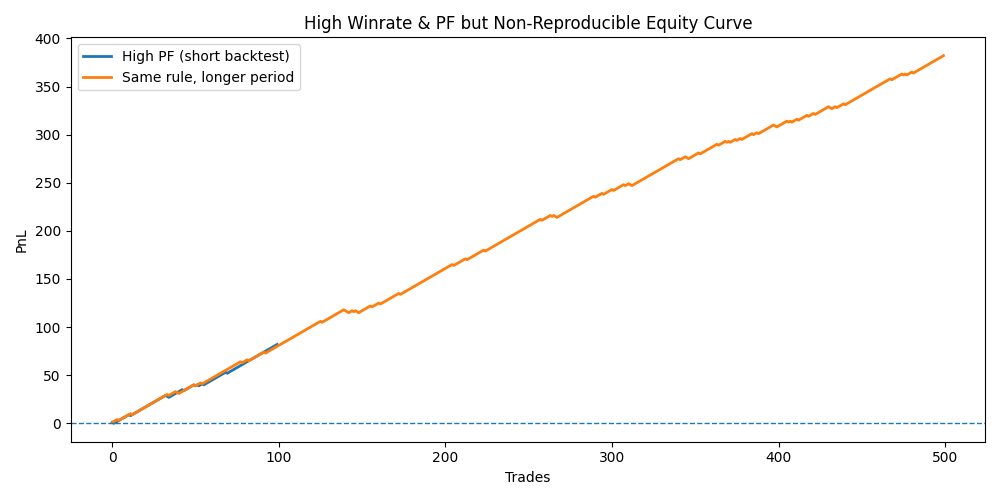
What Backtesting Reveals
Analyzing Win Rate, Average R, and Max DD Simultaneously
In a backtest, you can verify:
- Win Rate
- Average R-Multiple
- Max Drawdown
When you look at all three, you find countless cases where a 60% win rate leads to a total loss.
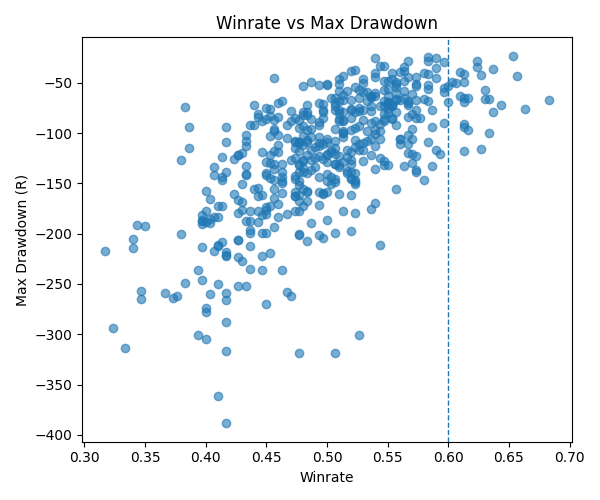
Cases Where Risk of Ruin Increases Despite 60% Wins
If your R-multiple is poor and your DD is deep:
- You may win temporarily.
- Eventually, your capital will not withstand the variance.
The Risk of Ruin is determined not by win rate, but by R-multiple and Drawdown.
Conclusion: Focus on "R-Multiple × Drawdown" instead of Win Rate
Win rate is a result. R-multiple and Drawdown are the structure.
Whether a discretionary strategy is reproducible depends entirely on its structural integrity—not its win rate.
Losing with a 60% win rate isn't an anomaly. It is the most common end-game for discretionary traders who ignore the math.
So, how should you actually judge your trading skill using these numbers?
I have summarized how to correctly interpret backtest results in the next article.