Introduction: Backtesting is Not the Act of "Looking at Win Rates"
When looking at backtest results, most people's eyes go straight to the win rate.
However, that is the easiest and most dangerous way to look at it.
Analysis screens in backtesting are not built to see "if you are winning," but to see "why it is turning out that way."
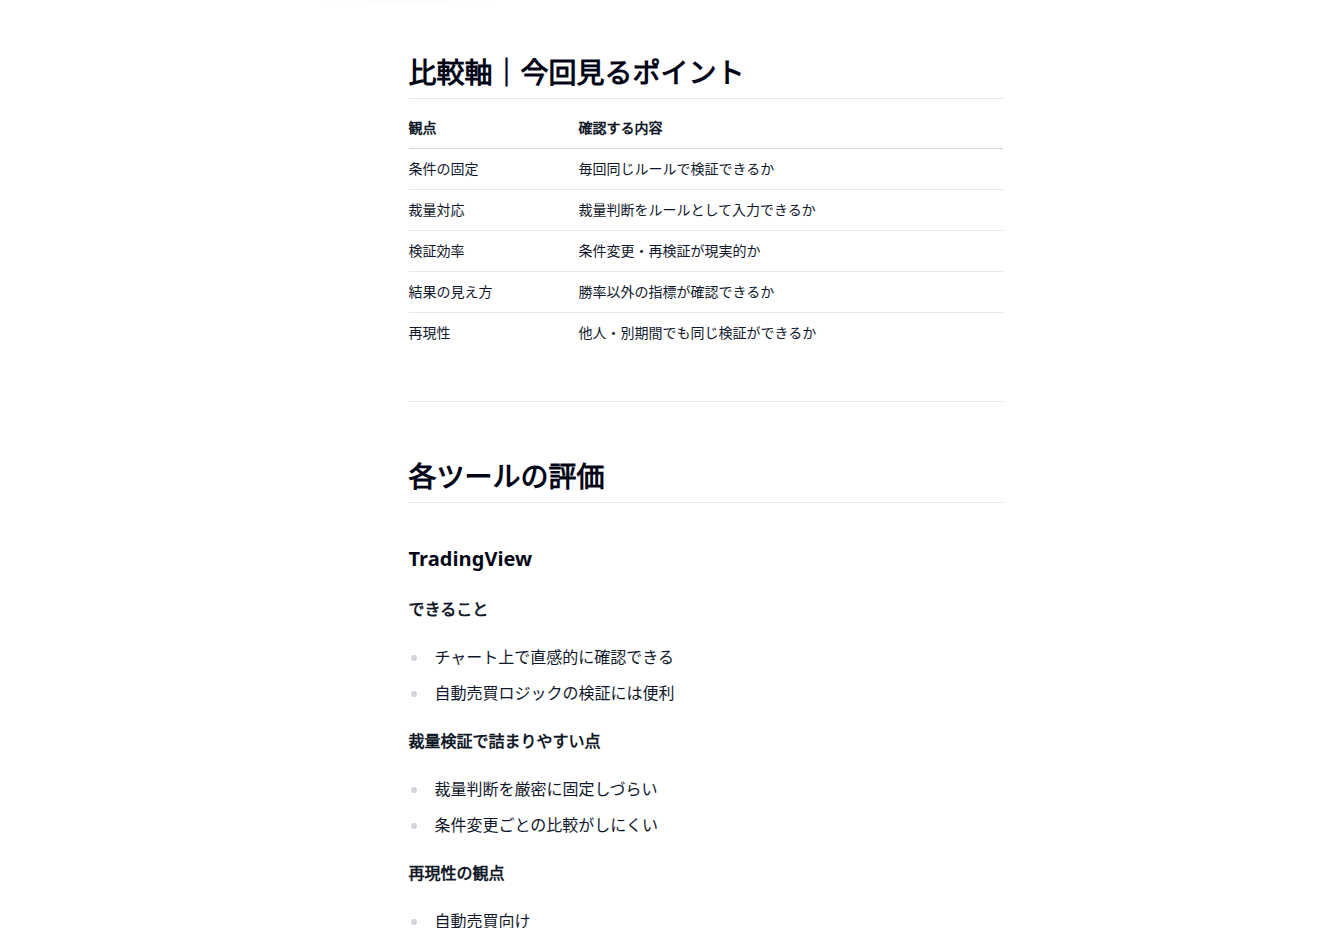
I've summarized a comparison of which backtest tools to use here, so please refer to it:
Overview: Grasping the Big Picture First
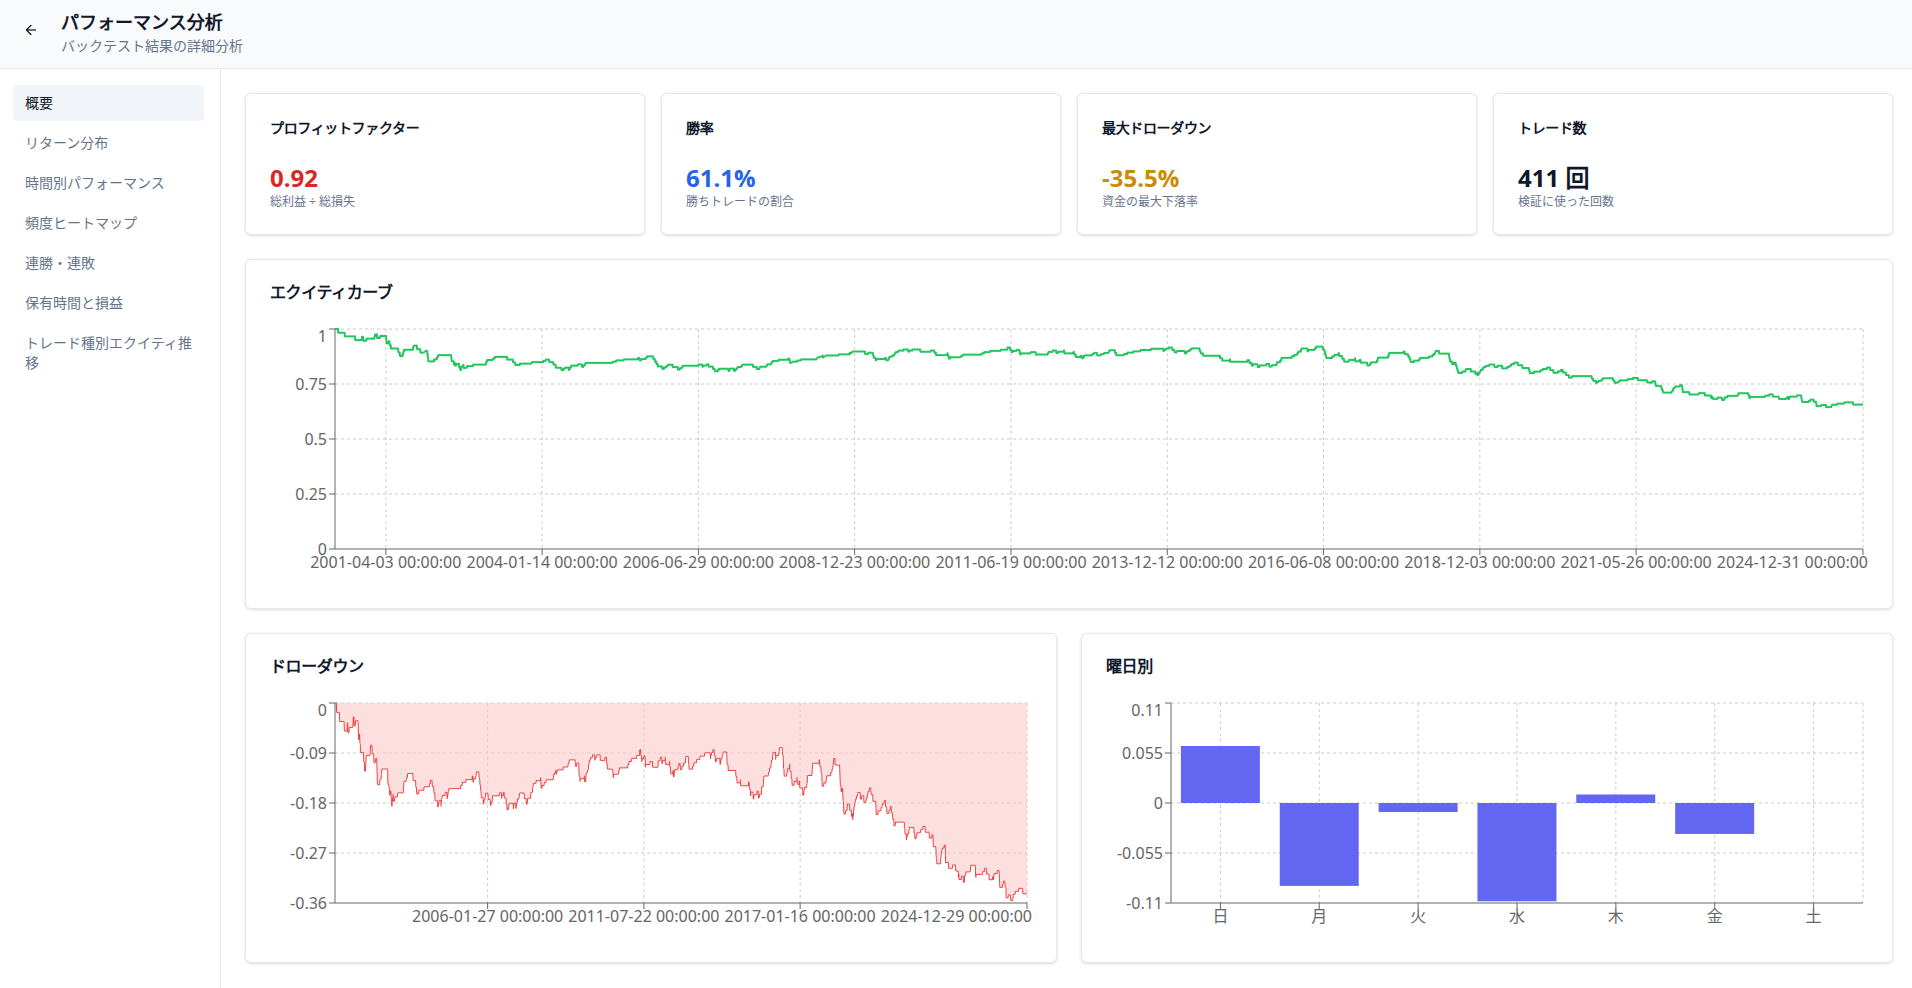
Prioritize the Profit Factor (PF) Above All
PF is Gross Profit ÷ Gross Loss.
- PF > 1.0 → Theoretically profitable
- PF < 1.0 → Guaranteed to lose in the long run
Even if the win rate is high, if the PF is below 1.0, the strategy is meaningless. For this article, I used a tool called Delver, which is available for free.
Win Rate is Merely "Supplementary Information"
Win rate is only one part of the outcome.
- Small wins
- Large losses
With this structure, you can easily lose even with a 60% win rate.
Max Drawdown is Your "Mental Durability Value"
Max DD is the number that determines whether you can actually continue a strategy.
- You can endure it numerically
- You cannot endure it mentally
This gap is a primary cause of breaking discretionary rules. Drawdown is a critical factor for future backtesting and general investing, so this article is a must-read:
Do Not Trust Results with Low Trade Counts
- Low number of trades
- Short duration
When these two align, performance can easily be inflated by luck.
Return Distribution: Observing the Habits of Wins and Losses
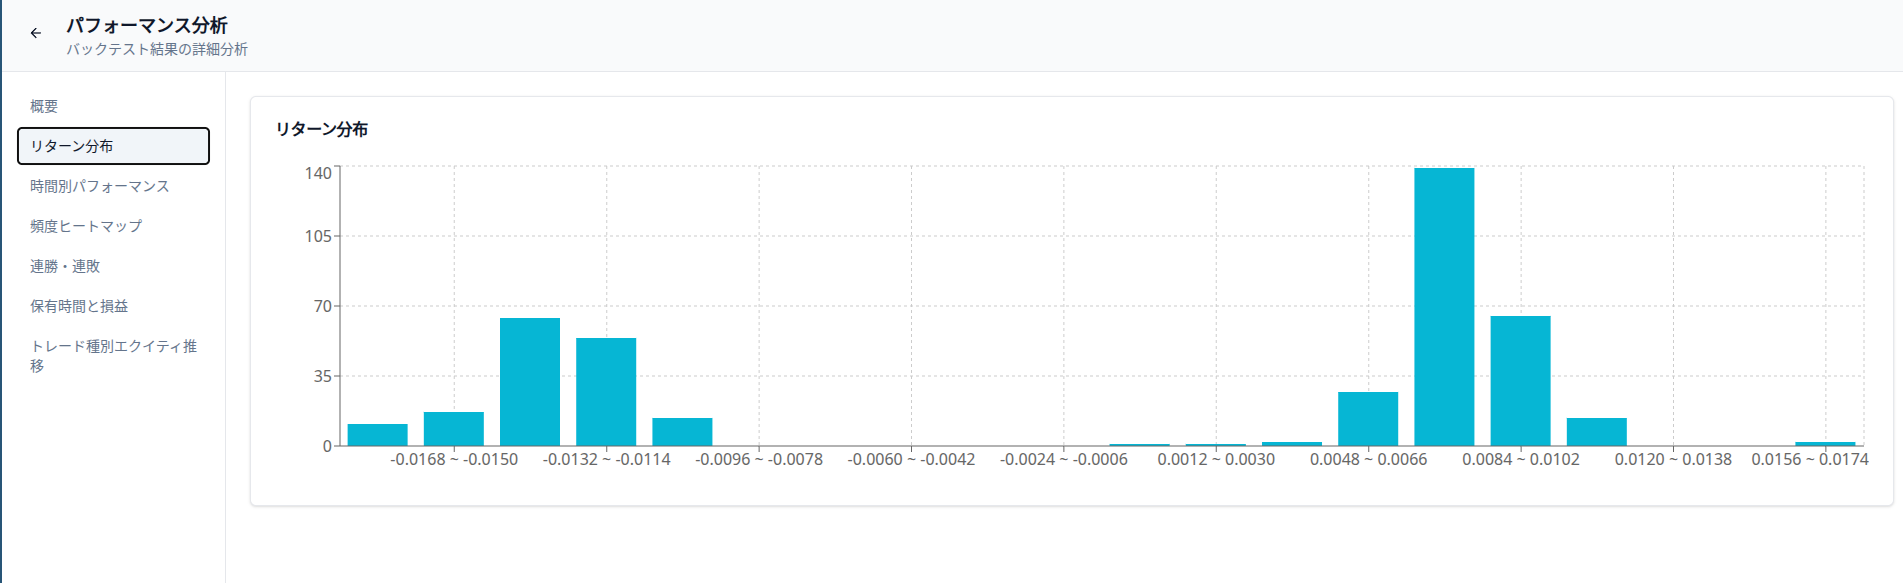
Look at the "Shape" Rather Than the Average
What you should observe is:
- Where the peak is located
- Which way it is skewed
Even if the average is positive, it is dangerous if the left side (loss side) is thick.
Is a "Big Loss" Hiding?
- Many small wins
- Occasional massive losses
This structure is the most common failure pattern in discretionary trading.
Performance by Hour: Bias in Market Participation
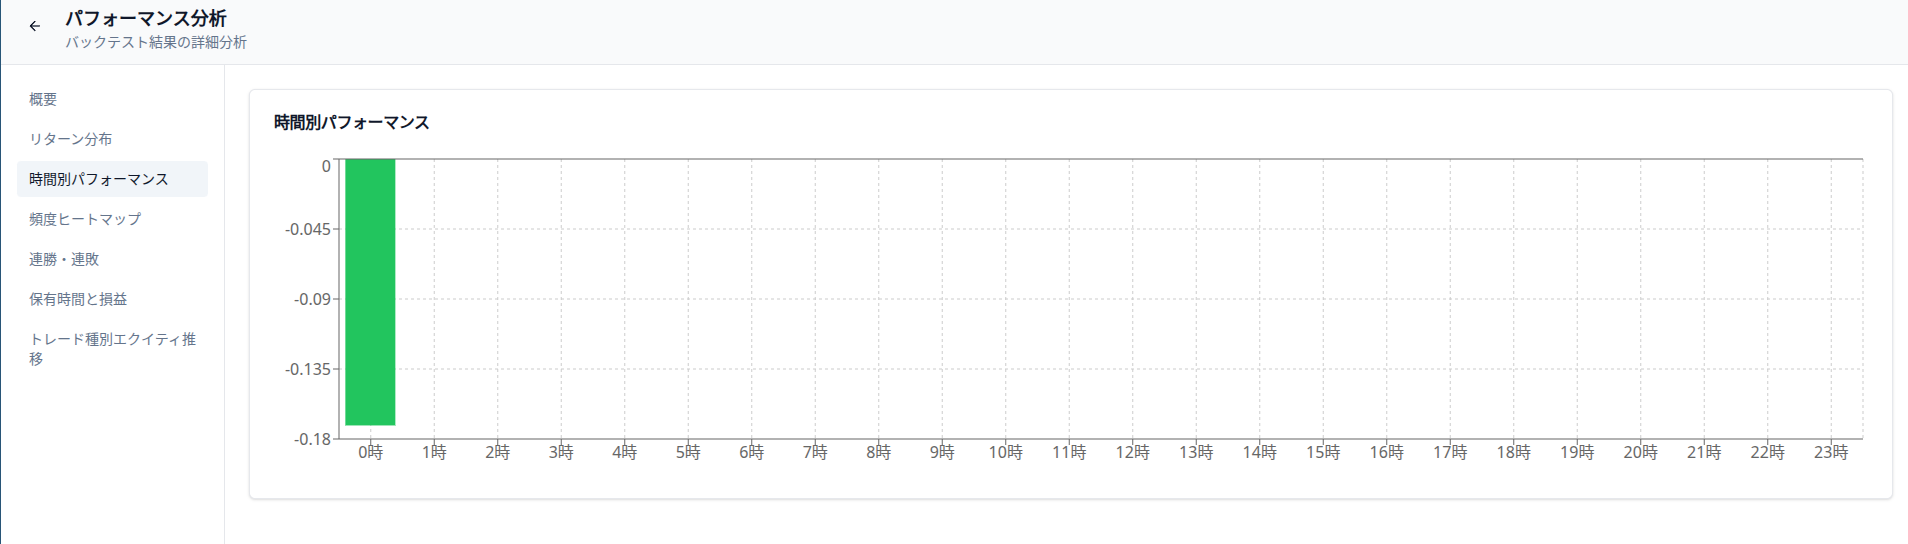
Winning and Losing Time Zones
A strategy that only wins during specific times:
- Dies instantly when the market environment shifts
- Has low reproducibility
The Possibility of "Winning Because of the Time"
There are many cases where success is due to coincidence of time rather than the strength of the strategy.
Frequency Heatmap: Suspecting Trade Concentration

Bias in Days or Hours is a Risk
- Higher volume on specific days
- Concentration at specific hours
This is often a sign of fragility rather than an edge.
Collapsing the Moment Market Conditions Shift
If the concentrated areas fail, the entire strategy stops functioning.
Streaks: Seeing Mental Destruction Power in Numbers
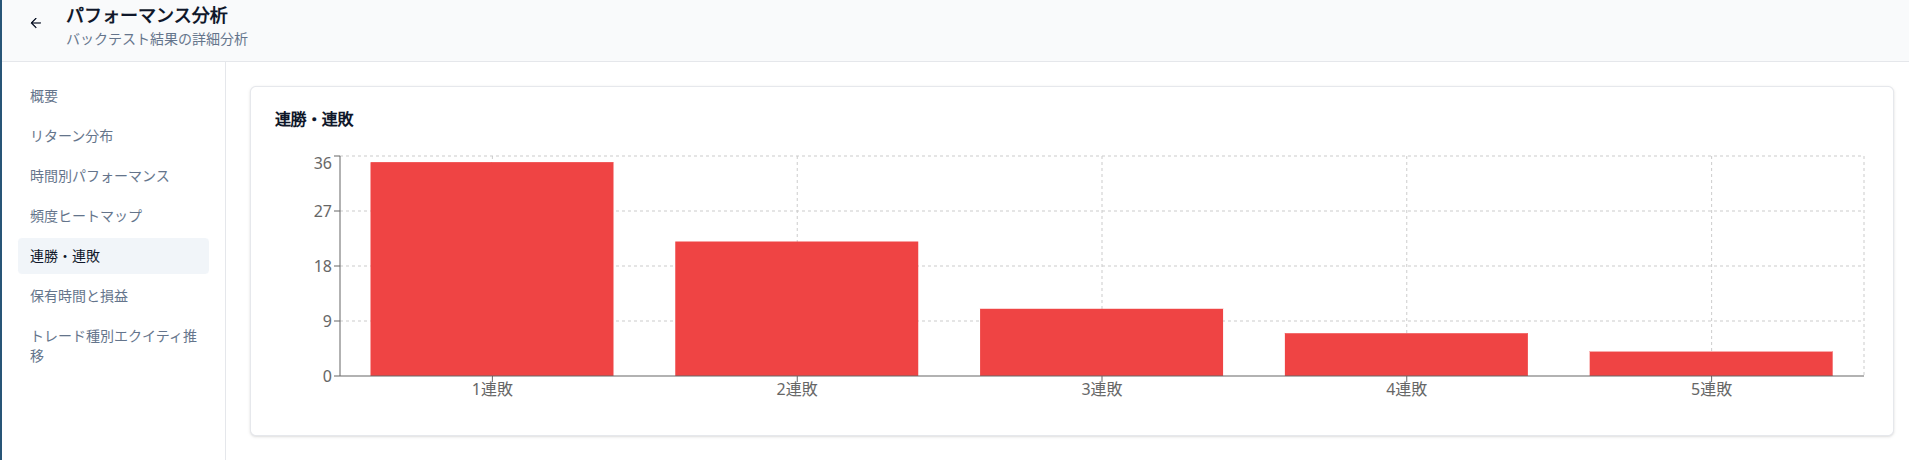
Always Check the Max Consecutive Losses
- People who break after 3 losses
- People who change rules after 5 losses
Max consecutive losses tells you the point where your discretion will break.
Losing Streaks Happen Even with High Win Rates
Win rate and losing streaks are almost entirely separate concepts.
Holding Time and P/L: Are You Dragging Out Unrealized Losses?
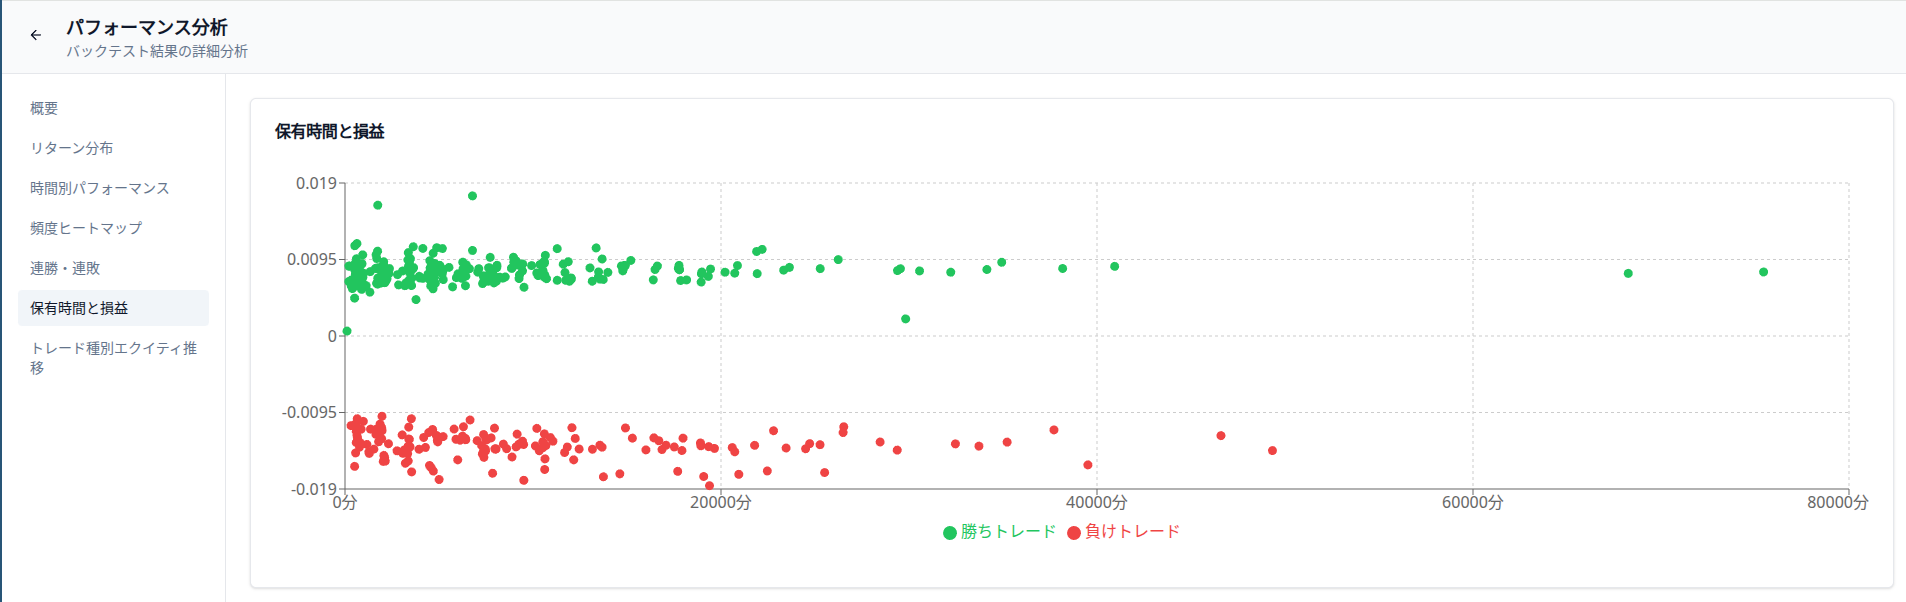
Time Difference Between Wins and Losses
- Closing wins immediately
- Holding losses for a long time
The larger this gap, the more skewed your R-multiple becomes.
The Moment "It Might Come Back" is Statistically Debunked
Holding longer does not necessarily improve expectancy.
Equity Transition by Trade Type: Breaking It Down
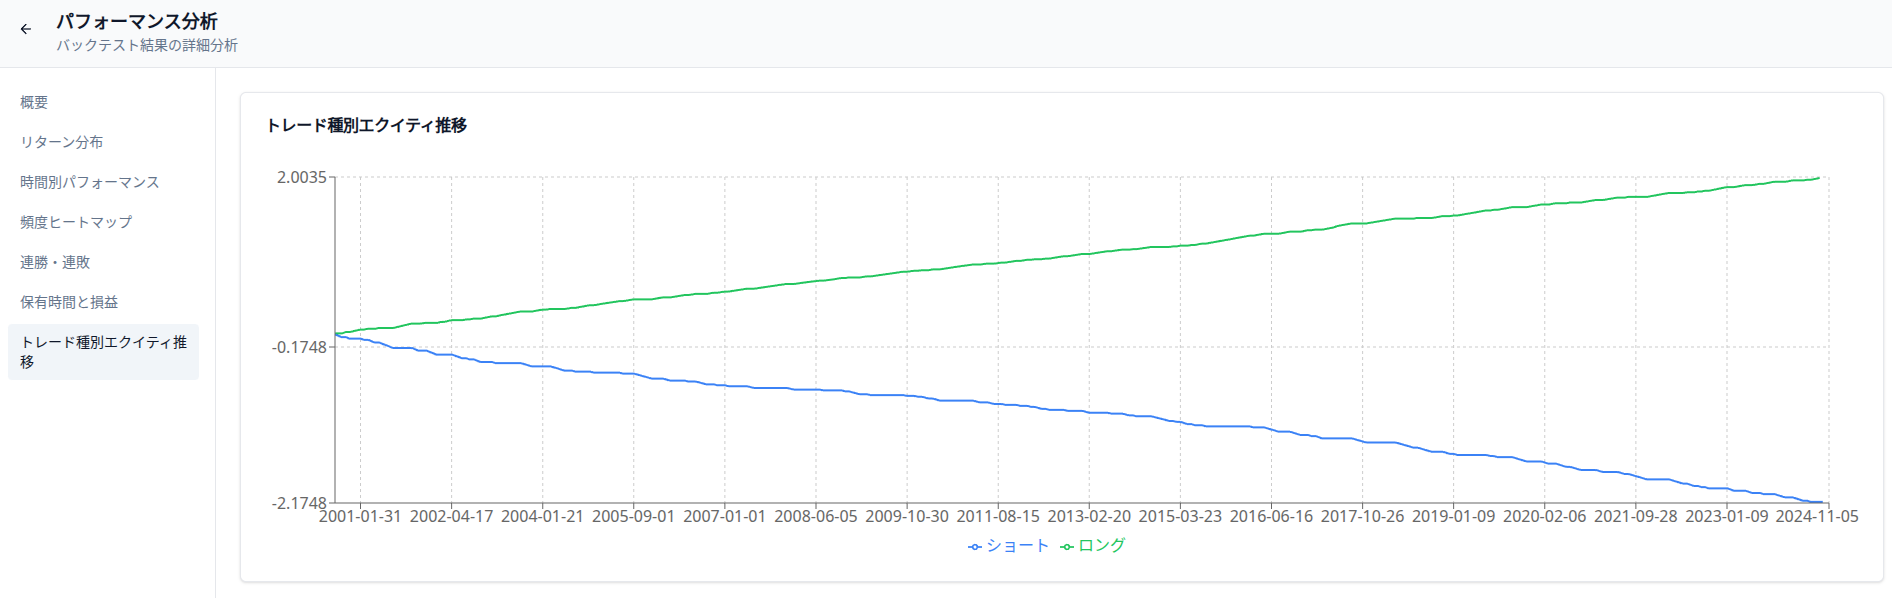
Longs and Shorts are Different Entities
- Longs trending upward
- Shorts dragging performance down
This scenario is extremely common.
You Lose Sight When You Group Everything Together
The essence of a strategy is only visible once you break it down.
Conclusion: Read Backtests "Cross-Sectionally"
Backtest results only have meaning when you read:
- Win Rate
- PF
- DD
- Distribution
- Time
- Streaks
...all across the board.
Once you understand that, you will stop wandering aimlessly in both discretion and systems.
The only tool used here was Delver. You can start verifying completely for free via the "Launch Delver" button at the bottom of the page.
Would you like me to analyze a specific equity curve or set of backtest data for you to identify its structural weaknesses?