You Started Using RSI, but Suddenly You Can't Win
When you first started using RSI, many of you likely felt that it "sort of worked."
- It bounced at "oversold" levels.
- It dropped near what looked like a "ceiling."
- It looked exactly like what was written in books or on the internet.
Yet, as you continue, you start to feel this way:
- Despite doing the "same thing," results are unstable.
- There is a huge gap between winning months and completely terrible months.
- A growing suspicion: "Is RSI actually useless after all?"
This sense of discomfort is a point that many discretionary traders pass through.
These phenomena are summarized in this article—please take a look:
RSI Is Not an Indicator That Outputs "Winning Signals"
What Does RSI Actually Measure?
RSI is an indicator that quantifies the balance between upward and downward movement (relative strength) over a certain period.
The important points are:
- It is not an indicator that "predicts" whether price will go up or down.
- It does not guarantee the direction of a trend.
Just because RSI exceeds 70 does not mean it is "decided" that price will drop from there.
Common Misconceptions When Trading Solely with RSI
In discretionary trading, it is often used like this:
- RSI at 70 or above → Sell
- RSI at 30 or below → Buy
While it looks simple, in actual markets:
- During strong trends, RSI can stay "pinned" at the top or bottom as price continues.
- "Oversold" or "overbought" conditions can persist for a long time.
RSI is a convenient indicator, but it is not so versatile that it can serve as the sole basis for an entry.
The Reason RSI Doesn't Work Isn't a Setting Error
When people feel they can't win with RSI, the first thing they suspect is usually the settings.
Can I Fix It by Changing the Period?
- Changing 14 → 9.
- Changing 14 → 21.
Certainly, the results will change. However, it does not guarantee they will stabilize.
Can I Improve It by Moving the 30/70 Levels?
- Changing to 20/80.
- Changing to 40/60.
This might look "good" temporarily. However, this method of verification is exactly the reason why people lose despite verifying.
Will Accuracy Increase If I Add Indicators?
- Moving Averages
- Bollinger Bands
- MACD
Before you know it, your chart is cluttered with information. What is happening here is a state where you are just tinkering with settings, but nothing fundamental has changed.
Why Do RSI Results Change So Much Every Time?
The biggest reason RSI "doesn't work" lies in the drifts unique to discretionary trading.
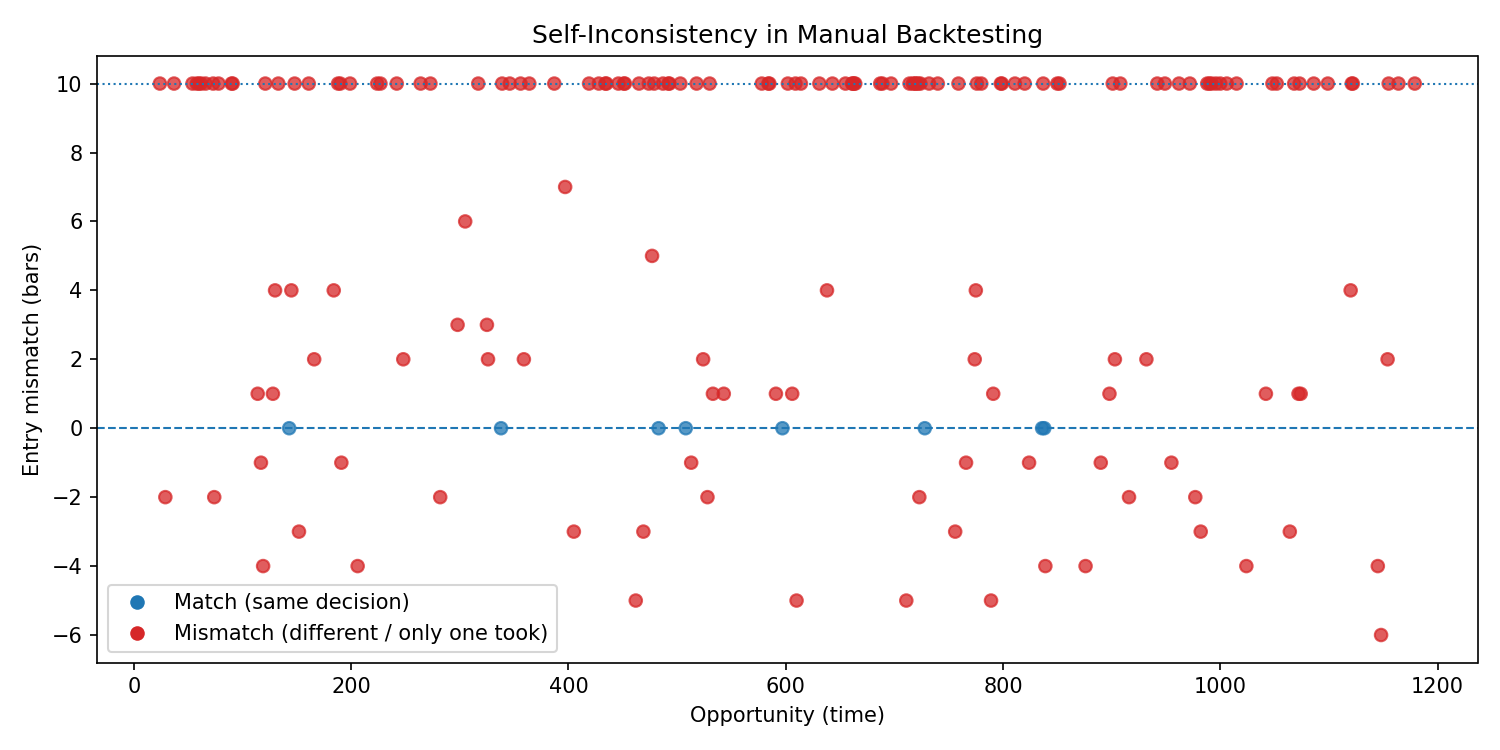
Even with the Same RSI, the "Entry Position" Is Different Every Time
- Entering before the candle closes.
- Waiting for a slight pullback.
- Waiting for the next candle.
Even if the RSI value is the same, the actual entry position drifts depending on the person or the moment. This drift cannot be reproduced when you try to verify it later.
Take Profit and Stop Loss Tend to Become "On-the-Spot" Judgments
RSI may serve as a guide for entry, but it is not an indicator that tells you:
- Where to take profit.
- Where to stop loss.
As a result:
- "It looks like it'll keep going, so I'll hold."
- "I'm somehow feeling anxious, so I'll cut it early."
These judgments mix in, and the trade content changes every time, even with the same RSI level.
Unconsciously Judging the Market Atmosphere
In discretionary trading, you are unconsciously thinking:
- "It looks like a trending market right now."
- "There seems to be volatility today."
- "This pattern looks dangerous."
While these are important as experience, because they are not fixed as rules, they cannot be reproduced in verification.
Looking at the Data: This Is What Happens with RSI
Let's stop talking about "feelings" for a moment and look at the data for an RSI strategy with completely fixed conditions.
Verifying with Simple, Fixed Rules
As an example, consider a simple rule:
- RSI 30 or below → Buy
- RSI 70 or above → Sell
- Fixed Take Profit and Stop Loss
- Fixed currency pair and timeframe
No discretion is allowed.
Tools that allow you to backtest indicators in general for FX are summarized in this article:

Results Become Entirely Different Just by Changing the Period
If you verify this rule by:
- Segmenting by year.
- Segmenting by market environment.
The following phenomena occur:
- High win rate in one period.
- Consecutive losses in another period.
- Maximum drawdown fluctuates wildly.
Even though the RSI itself hasn't changed, the results collapse simply because the market environment changed.
If You Only Look at "Where You Won," Everything Seems to Work
If you:
- Clip out only the periods where you are winning.
- Remember only the successful examples.
It will look like "RSI works." However, that is just looking at it after the fact, and it is no guarantee that you can produce the same results in live trading.
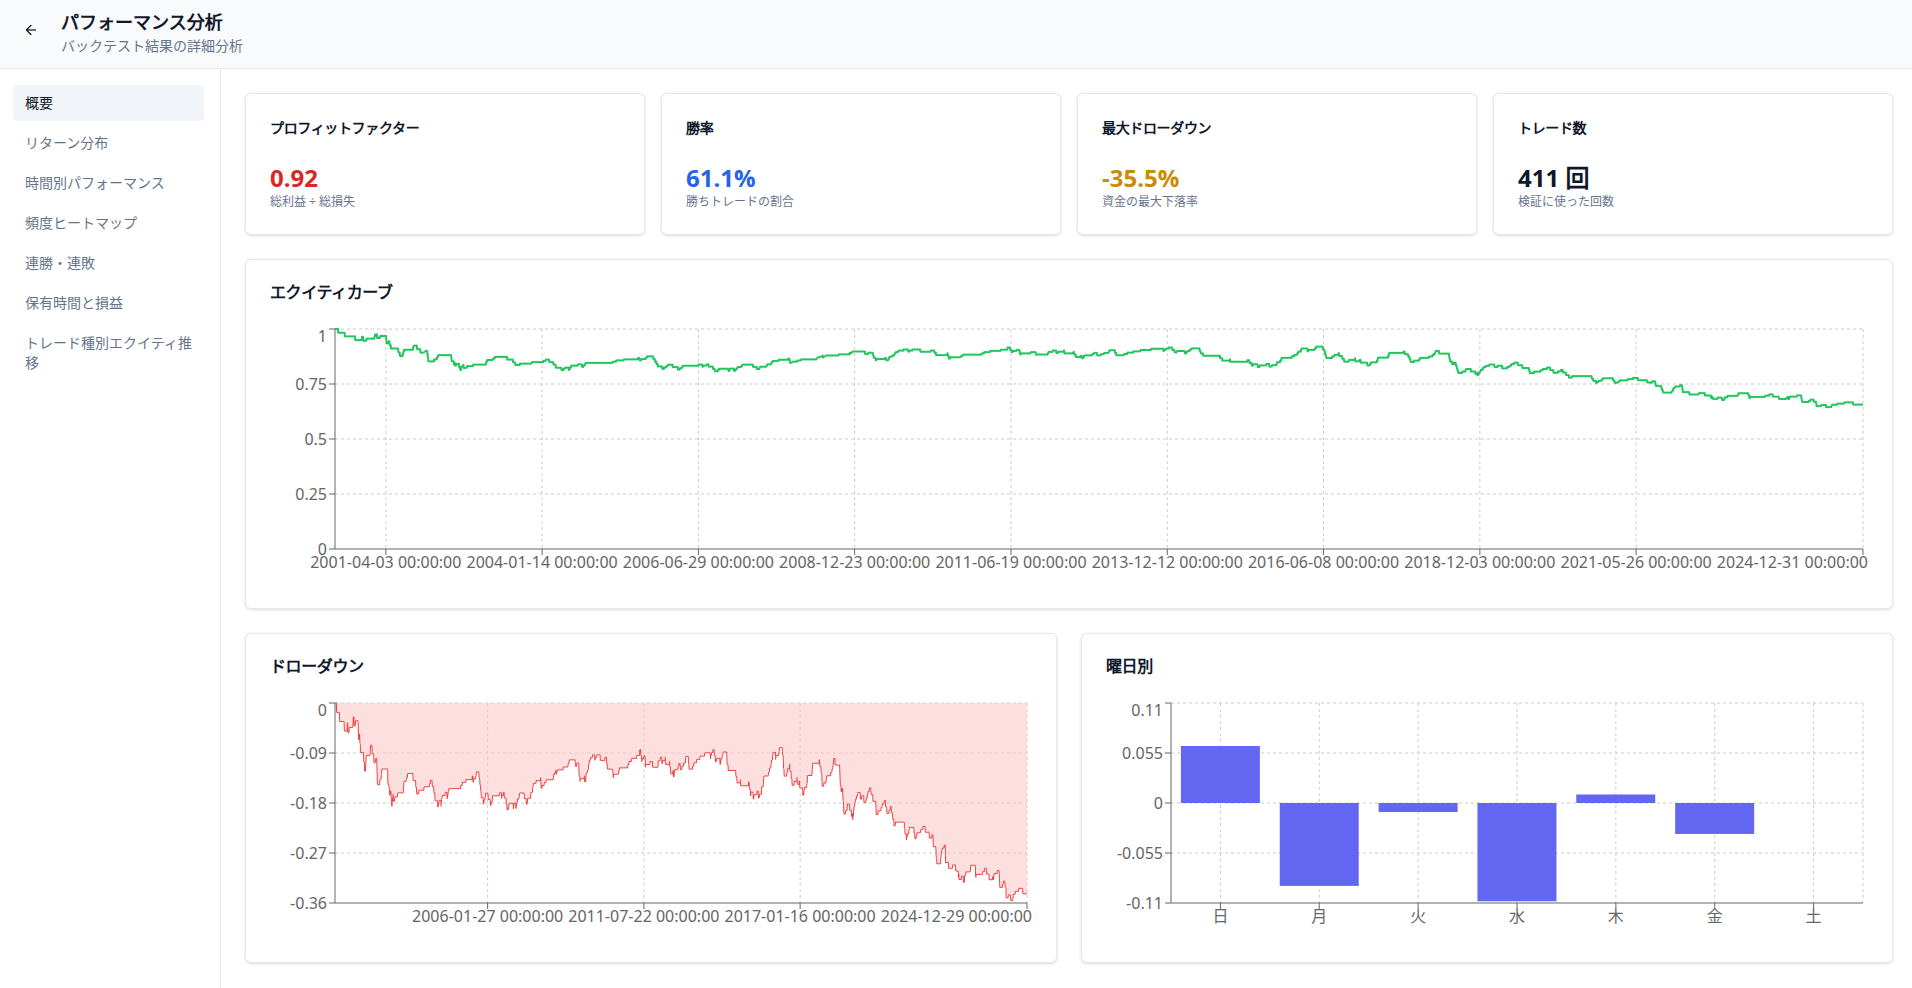
RSI Equity Curve Segmented by Year
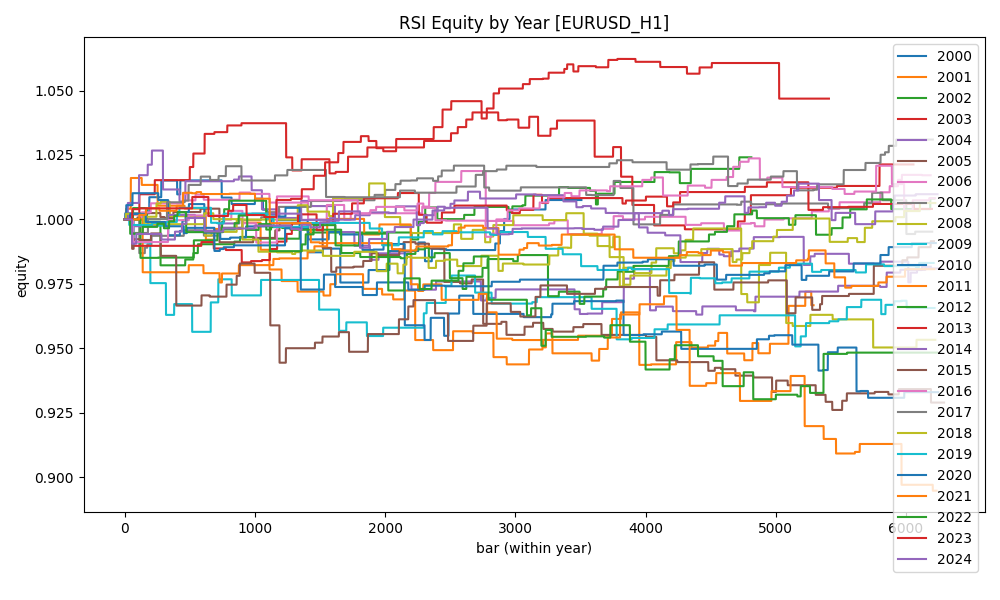
This is a breakdown of RSI strategy results by year using the same rules, currency pair, and timeframe. Looking at this graph, you can see that:
- Years with an upward curve.
- Years that are almost flat.
- Years that collapse halfway through.
...all exist simultaneously. The RSI logic itself hasn't changed at all. The only thing changing is the market period.
Looking at Maximum Drawdown by Year
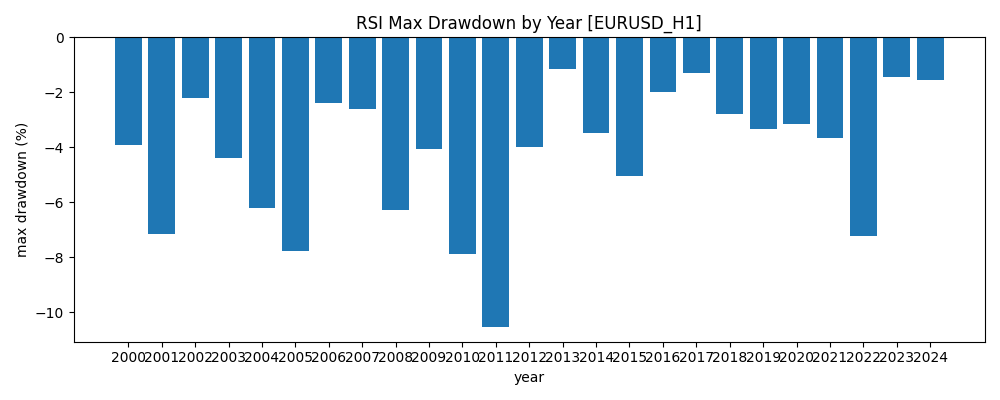
Next, here is the annual maximum drawdown using the same RSI rules. Depending on the year:
- Some years end with just a few percent.
- Some years experience drawdowns near double digits.
This is not a discretionary error. It shows that even with the same rules, the amount of risk you must endure differs completely year by year.
To read correct backtest results like these, you need to understand several key points. We have organized them in the following article:
It's Not That RSI Is Bad. The Problem Is "Consistency."
As we have seen:
- It's not that RSI is "bad."
- It's not that RSI is "outdated."
The problem is that in discretionary trading:
- Entries
- Exits
- Market judgments
...drift slightly every single time.
You Are Under the "Illusion" of Doing the Same Thing
In terms of human sensation:
"It's the same RSI pattern as before, so it's the same trade."
Even if you think this, in reality, the conditions are not aligned.
That’s Why Verification Yields No Answers
If you verify while conditions are not aligned:
- You can't judge if you can win.
- You can't judge if you should lose.
- You can't judge if you should improve.
This is the real reason why people say "RSI doesn't work."
These phenomena don't just happen because it's discretionary; even if you backtest accurately and obtain correct data, if the reader is human, biases kick in, and the win rate or DD in practice will deviate from the data.
If You Use RSI, It's Meaningless Unless You Align These Minimums
If you are to continue using RSI, you need at least these three things:
- Fix entry conditions numerically.
- Don't change Take Profit and Stop Loss based on "feeling."
- Don't add market conditions after the fact.
Only when these are aligned can you treat RSI trade results as "something that can be verified."
Accordingly, what should you do to verify them? We have summarized detailed backtesting methods on the next page—please refer to them.