Why Do Traders Go Broke Despite "Winning"?
Most traders immediately stop thinking about the possibility of bankruptcy the moment they see phrases like "high win rate" or "positive expectancy."
In reality, however, the number of people who get forced out of the market while they are supposedly winning never ends.
The problem is not the strategy; it’s how you handle Maximum Drawdown (Max DD).
As a prerequisite for this article, you first need to know your win rate and DD. Tools to easily find these are summarized here:
Bankruptcy Happens Even When Win Rates and Expectancy are Positive
Win rates and expectancy are matters of "long-term averages." Bankruptcy, on the other hand, occurs during the "process."
- Even if the win rate is 55%
- Even if the expectancy is positive
The moment a losing streak clusters, your capital becomes unable to endure.
This fact is determined by probability, not intuition.
The reasons why you can go broke even with a 60% win rate are summarized in this article—please take a look:
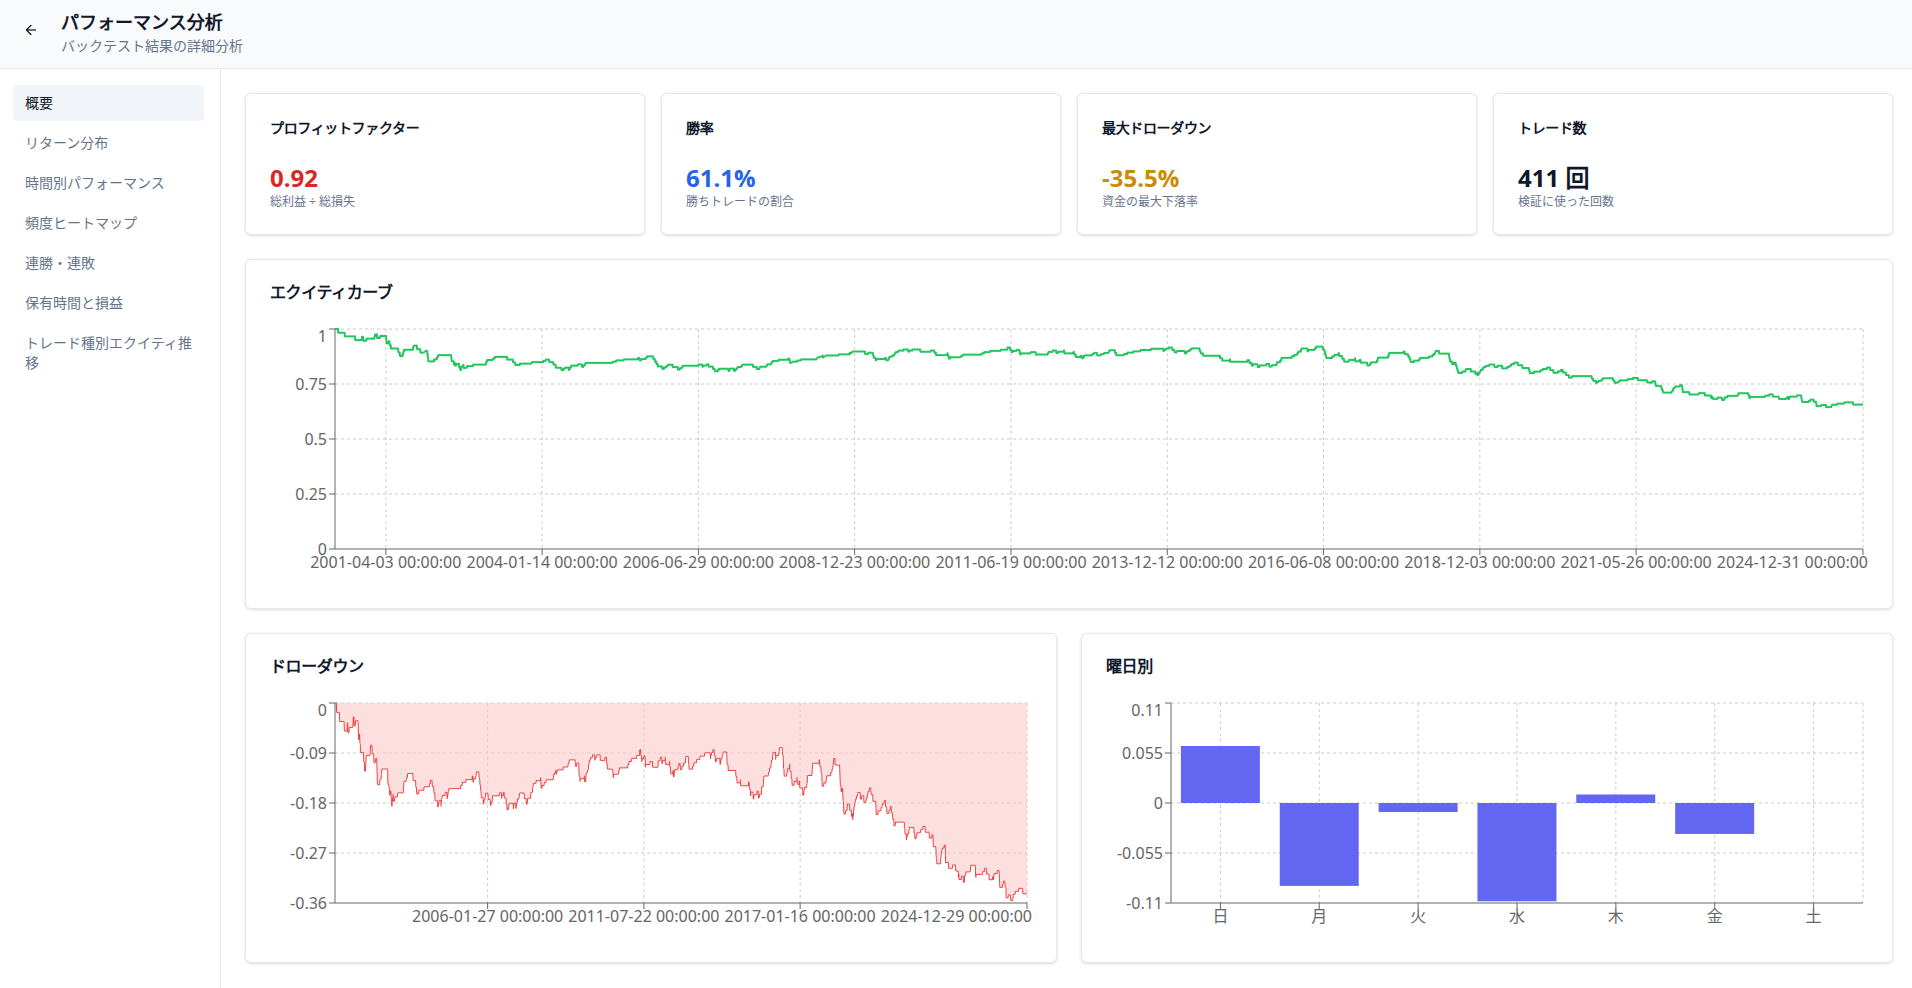
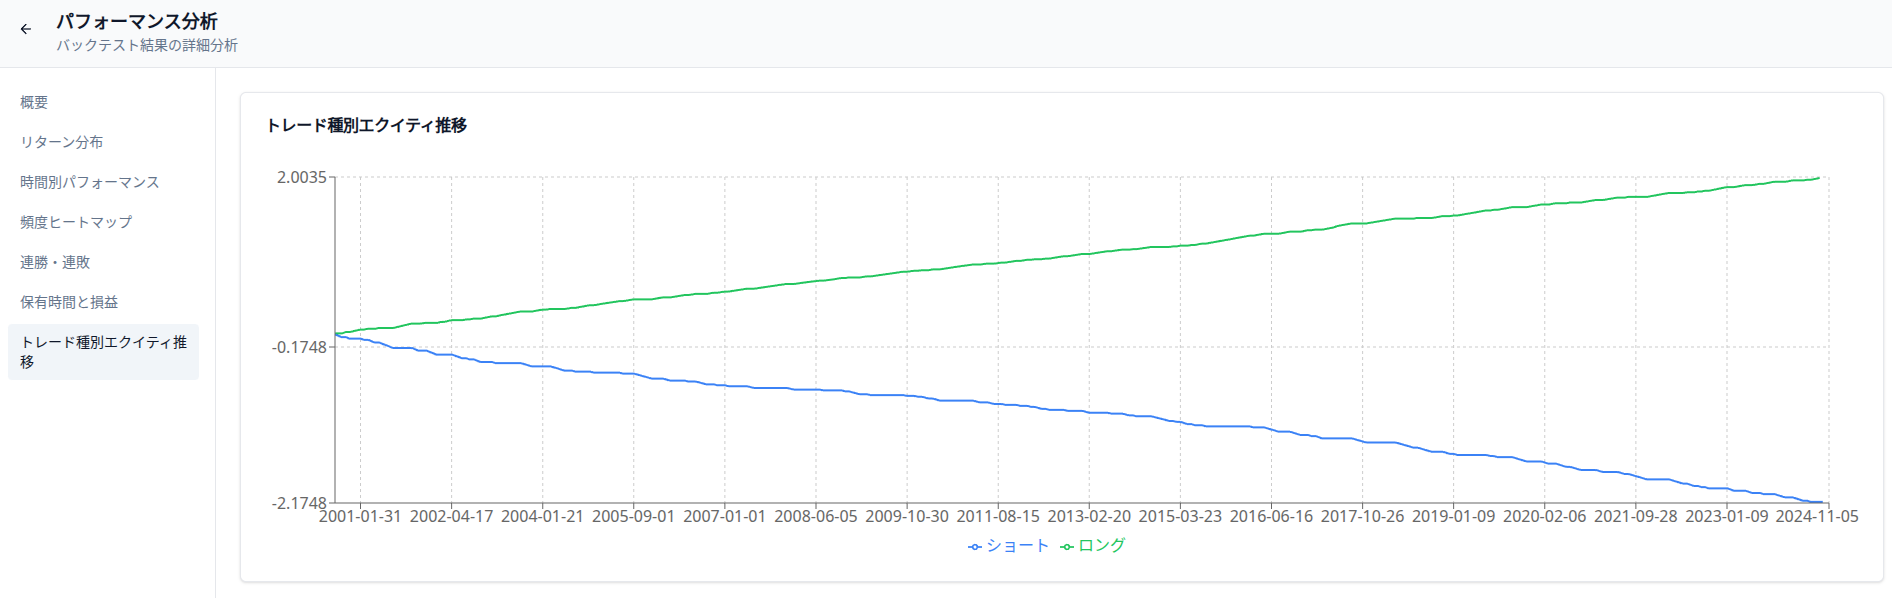
Why Most People Don't Look at the "Underbelly of the Equity Curve"
When looking at verification results, most people do the following:
- Look at the final profit/loss
- Look at whether it’s trending upward
But what you really should be looking at is how deep it could potentially sink along the way.
What Does Maximum Drawdown (Max DD) Actually Mean?
Definition of Maximum Drawdown (From Peak to Trough)
Maximum Drawdown is:
The maximum percentage decline from a specific peak in capital to the subsequent capital bottom.
It represents the cumulative result of a series of losses, not just a single loss.
Why It's a Metric for "Durability" Rather Than Just Unrealized Loss
Max DD doesn't show "how much you lost," but rather:
How much you must be able to endure.
If you can't endure it, the strategy might win in theory, but cannot be continued in reality.
Why You Shouldn't Misinterpret Max DD as "Past Results"
Max DD is not just a history log. It is an example of a "worst-case scenario" that could occur in the future.
The moment you treat this as mere past data, your money management is doomed.
Maximum Drawdown is Simply the Result of a "Probability Distribution"
DD is Not a "Fluke" or an Accident
Maximum Drawdown is not an "accident" that happens because of:
- A specific market
- A specific mistake
- A specific period
It is a result that inevitably exists in the tail of a probability distribution.
DD Changes Every Time, Even for the Same Strategy
Even with the same win rate, same risk-reward (RR), and same rules, simply changing the order of trades creates cases where:
- You get by with a shallow DD
- You crash into a fatal DD
...simultaneously.
Why Looking at "Average DD" is Pointless
The average value hides the cases you want to happen least.
What causes bankruptcy is not the average, but the "tail."
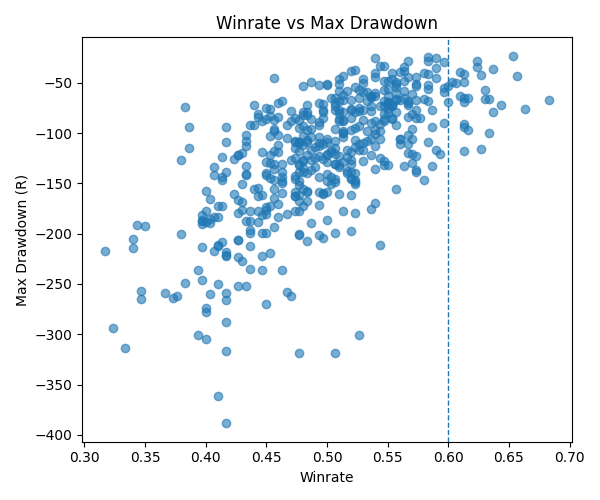
How is the Risk of Ruin Determined?
Win Rate, RR, and Risk per Trade Determine the Risk of Ruin
The probability of bankruptcy is almost entirely determined by:
- Win rate
- Risk-Reward (RR)
- Risk percentage per trade
The type of market doesn't matter.
If you have never calculated the risk of ruin for your strategy, it’s like driving a car on a highway blindfolded. Using [Delver's Statistical Analysis Features], you can visualize that risk in seconds.
Losing Streaks are Inevitable, Not "Abnormal Events"
People perceive losing streaks as "bad luck," but probabilistically, they are events that are guaranteed to happen.
The question is:
Is your capital management designed to withstand that losing streak?
Why Unexpected Losing Streaks Will Always Come
The maximum losing streak seen in short-term verification will inevitably be updated in live trading.
A design that doesn't account for this will collapse over time.
Numerical Example: How Money Management Ignoring Max DD Leads to Ruin
Capital Collapse Even at 2% Risk per Trade
Below are the results of a Monte Carlo simulation for a strategy with the same win rate and RR.
While most curves trend upward, several lines crash into the bankruptcy line.
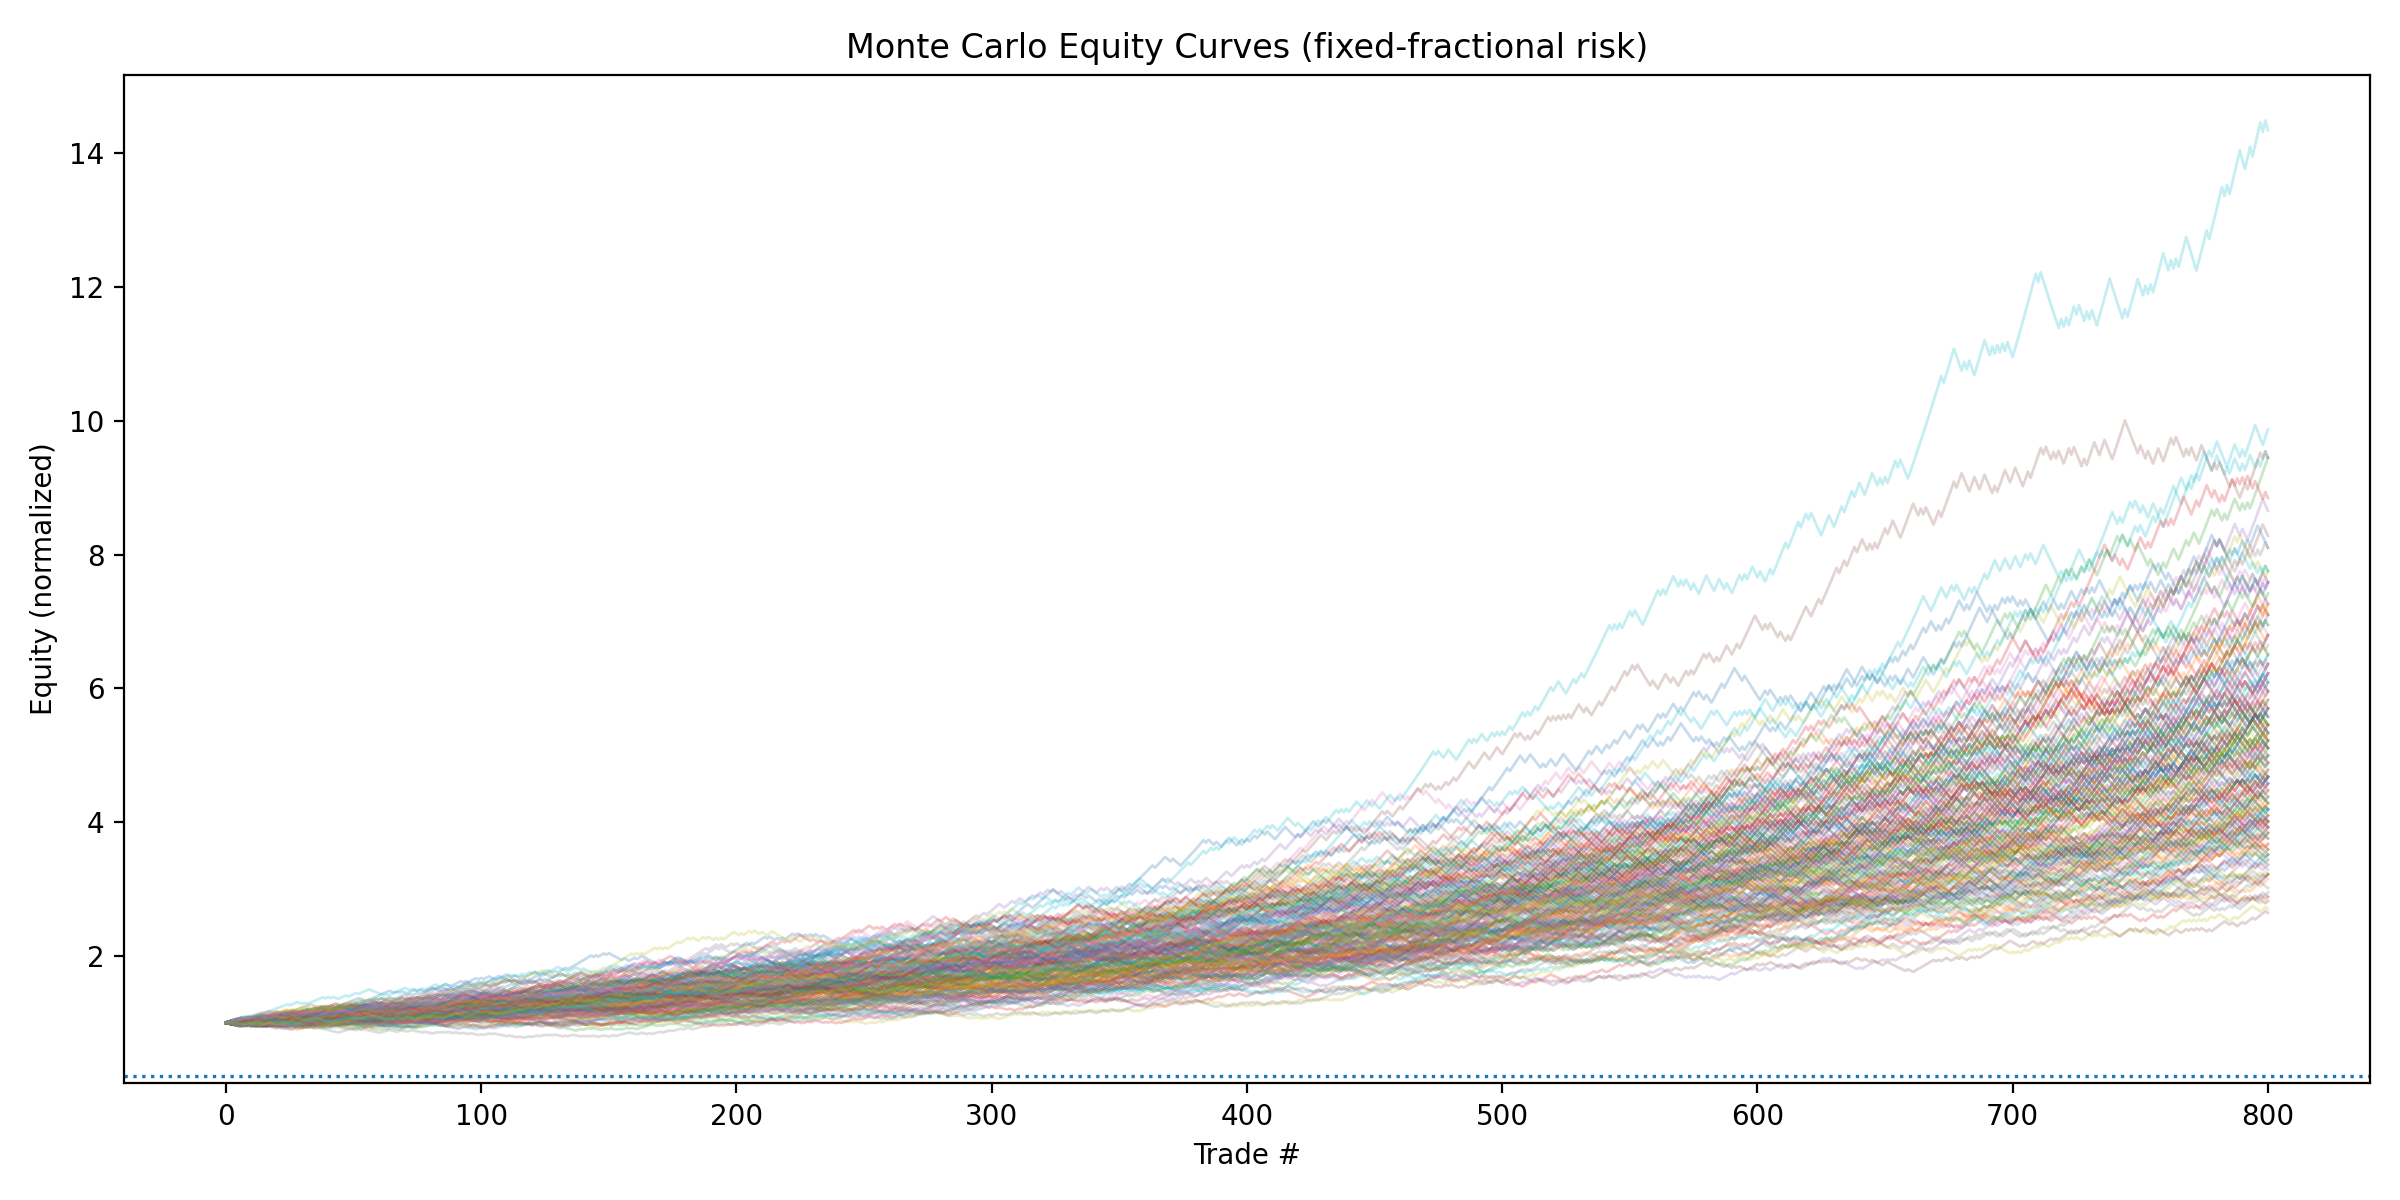
This isn't because the "trader is bad." It’s simply because losing streaks clustered by bad luck.
You might be shocked by the simulation results. However, heading into live trading without knowing this is far more dangerous. Try running a simulation on your own strategy.
The Line Where a Single DD Becomes Irrecoverable
The more capital you lose, the harder it becomes to recover.
The Asymmetry of Drawdown and Recovery Rate
To recover from a 30% loss, you need a 43% profit.
If you lose 50%, you must win 100% just to get back to square one.
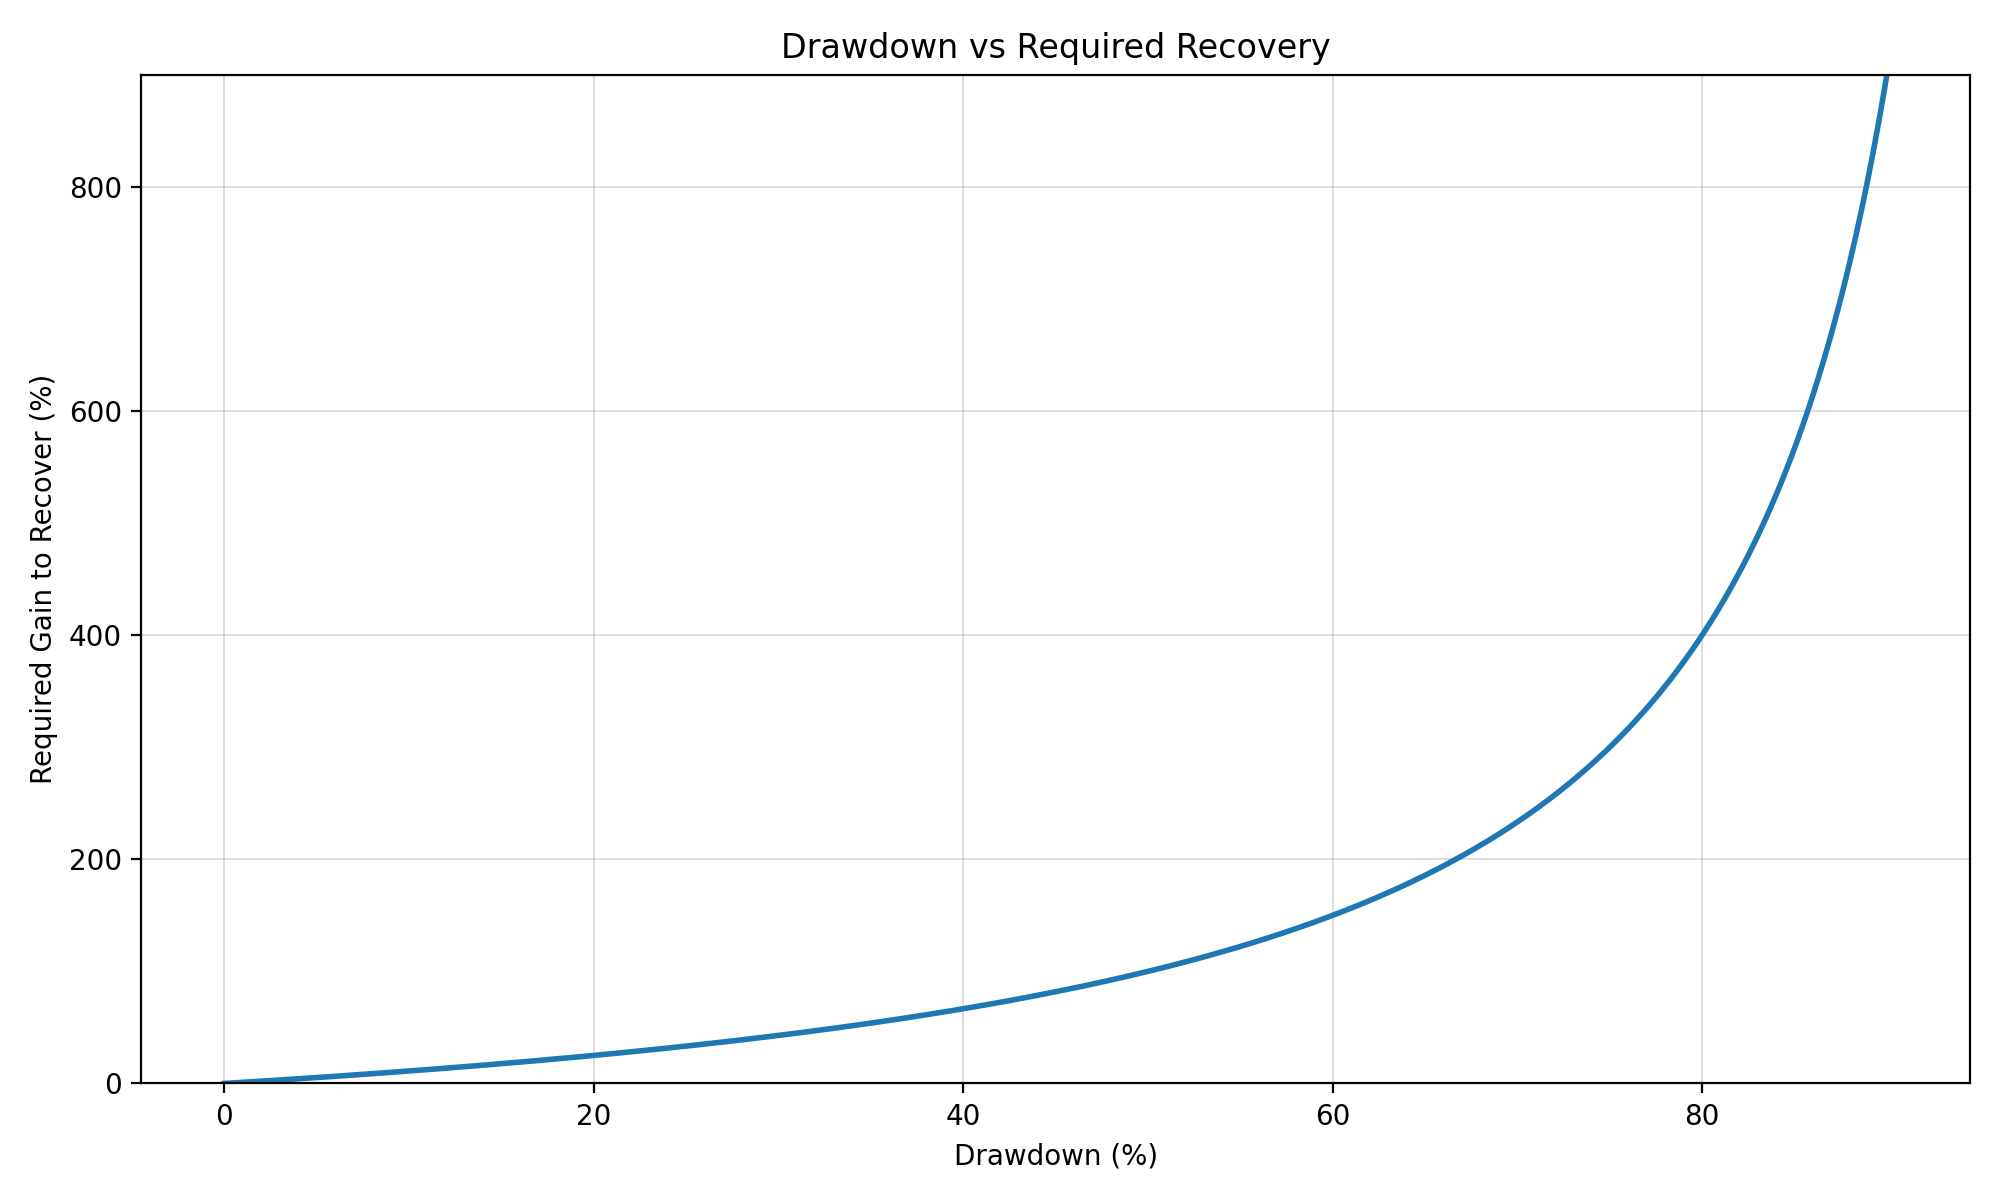
This isn't a matter of willpower or grit; it's a matter of arithmetic.
A "Strategy That Doesn't Go Broke" is Different from a "Strategy You Can Continue"
Cases That Don't Go Broke in Theory but Cannot be Continued in Reality
Even if the risk of ruin is theoretically zero, a strategy that:
- Has a DD that is too deep
- Takes too long to recover
...is one that humans will quit halfway through.
The Invisible Constraint: Mental Durability
Deep valleys in the equity curve trigger judgments such as:
- Lowering the lot size
- Distorting the rules
- Stopping the trade altogether
The Moment DD Distorts Trading Judgments
Maximum Drawdown breaks the human side, not the strategy.
Why is Maximum Drawdown Downplayed in Most Verifications?
The Problem of Short Backtest Periods
In a verification of about 100 trades, truly dangerous DDs don't show up.
The Psychology of Intentionally Ignoring the Worst Case
People bring wishful thinking like "It'll probably be fine" into their verification.
We explain how to correctly read backtest results and actual verification data in this article:
The Trap of Adopting Only Aesthetic Performance Metrics
PF and win rates can create beautiful numbers.
DD presents the harsh reality.
Drawdown Metrics You Should Really Look at During Verification
Why You Should Look at "95th Percentile DD" Instead of Max DD
Instead of a single maximum value, you should look at:
The DD that must be endured in 95% of cases.
Verification Without Looking at DD Distribution is Not Verification
Below is the difference between Max DD distributions seen in short-term verification versus long-term simulation.
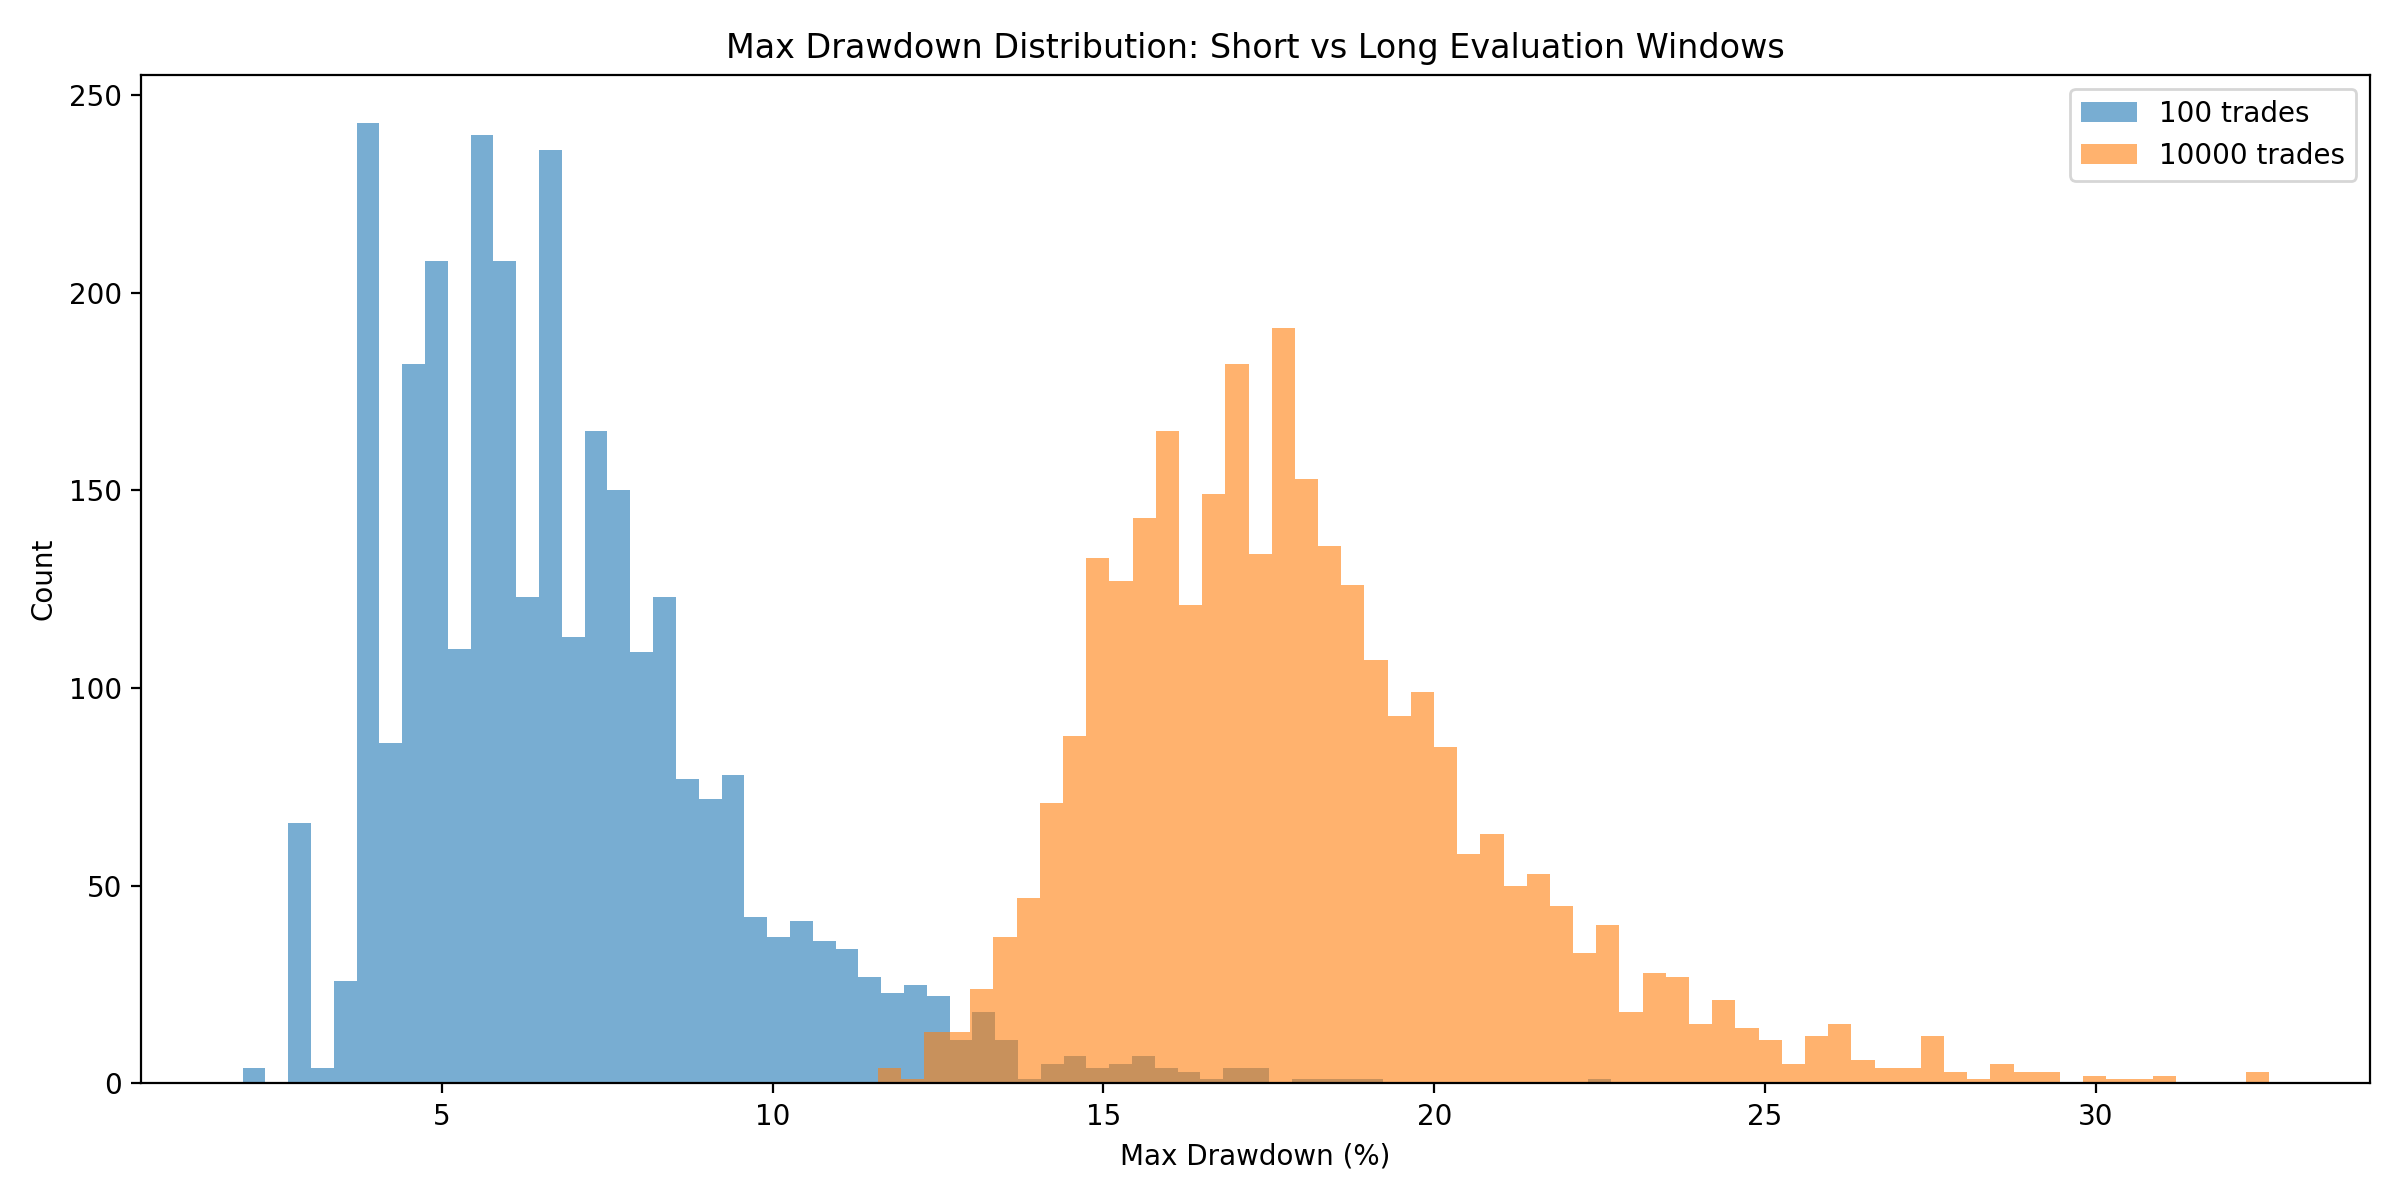
The shorter the verification period, the more DD is underestimated.
Money Management is Part of the Strategy
Calling only the entry "the strategy" is an error.
It only becomes a strategy when money management is included.
Summary | As Long as You Downplay Max DD, Your Risk of Ruin Will Not Decrease
Bankruptcy is a Design Flaw, Not Luck
Bankruptcy is not the fault of the market or bad luck.
It is the result of how you handled Max DD.
Survival Trading Starts with DD Design
Design whether you can survive before you think about winning.
Unless you can do that, your trading will probabilistically collapse.
Many tools for analyzing win rates and DD are available for free. We have summarized them in the article below, limited strictly to completely free tools—please take a look.
