5 Reasons Why Discretionary FX Lacks Reproducibility | The Reality Revealed by Backtesting
Introduction
"I can win even with discretionary trading."
Almost every trader has experienced a moment where they felt this was true.
When you look at a chart and think, "This looks like it will trend" or "This pattern is similar to the last one," and you actually make a profit, you start to believe that your market intuition is functioning.
However, when you attempt to fix that discretionary judgment as a set of rules and reproduce it via backtesting, the results rarely align with reality in most cases.
In this article, we:
- Quantified discretionary judgments as much as possible.
- Conducted backtests under identical conditions.
- Compared the results with actual live trading performance.
Based on these steps, we have organized why discretionary FX loses its reproducibility.
The conclusion isn't that discretionary trading is "bad."
It's simply that discretionary trading possesses a structure that is inherently impossible to reproduce.
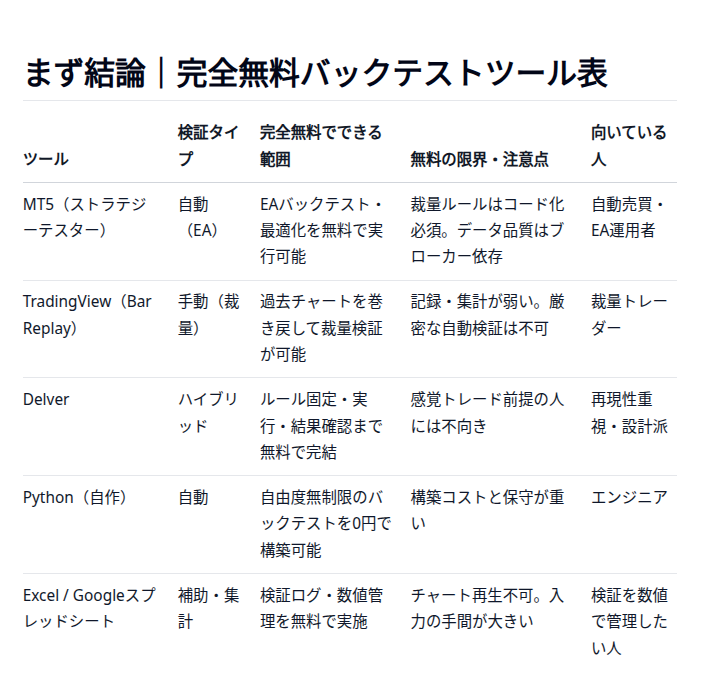
Check out our top 5 free backtesting tools here:
Reason 1: Continuous Drifting of Judgment Criteria
This is the primary reason discretionary FX cannot be reproduced.
Even when the trader believes they are making the "same judgment," the criteria actually shift slightly every single time.
The Illusion of Having a "Rule"
When you talk to discretionary traders, they often say:
- "I enter when this pattern appears."
- "I judged this as a pullback."
- "I felt the momentum was strong."
In their minds, these are consistent "rules."
However, these are not fixed numerically.
- How many pips defines a "pullback"?
- Which timeframe is the primary anchor?
- Exactly what level of velocity constitutes "strong momentum"?
These factors shift subtly based on subjective feeling every time.
Quantifying the Drift in "Same Judgments"
To test whether discretionary judgments are truly consistent, we verified them using actual historical data.
Verification Conditions (The Dataset)
The data used for this verification is as follows:
- Currency Pair: EUR/USD
- Timeframe: 1-Hour (H1)
- Period: 2000 – End of 2024
- Total Sample Size: Approx. 7,500 trades
Instead of a small snapshot, we verified over 20 years of real-world data collectively.
What We Compared
We compared the following two types of entries:
-
Rule-Based Entry → Entering mechanically the moment a breakout occurs.
-
Discretionary Entry (Pseudo) → Observing the same breakout but including the "timing drift" common in discretionary trading, such as "waiting a bit" or "seeing how it looks."
This reproduces the common situation in discretionary trading where "the pattern is the same, but the entry timing is subtly different."
Numerical Summary of the Discretionary Drift
The table below summarizes the difference between discretionary and rule-based entries over approximately 7,500 trades.
| Metric | Price Difference | ATR-Normalized Drift | Entry Timing |
|---|---|---|---|
| Count | 7,478 | 7,478 | 7,478 |
| Mean | -0.00003 | -0.01 ATR | 2.5 candles later |
| Std. Deviation | 0.0026 | 1.53 ATR | 1.71 candles |
| Minimum | -0.024 | -16.15 ATR | 0 candles later |
| Maximum | 0.029 | 15.43 ATR | 5 candles later |
The standard deviation exceeds 1.5 ATR, and in extreme cases, a drift of ±15 ATR or more was confirmed.
This level of variance far exceeds the range of "fine-tuning" and proves that these cannot be considered the "same judgment."
Entry Price Difference (ATR-Normalized)
Even with the same breakout judgment, the actual entry price is widely dispersed in ATR terms.
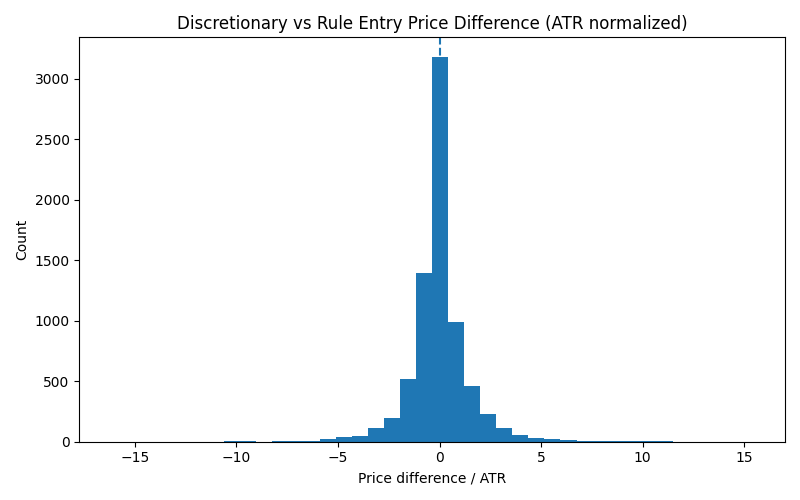
- Sample size: Approx. 7,500 trades
- Standard deviation of price difference: Approx. 1.5 ATR - Extreme drifts of ±15 ATR or more were also confirmed.
This is not a "minor error," but a level of drift equivalent to taking a completely different trade.
Entry Timing Drift
Next, we visualized "how many candles after the breakout" the entry occurred.
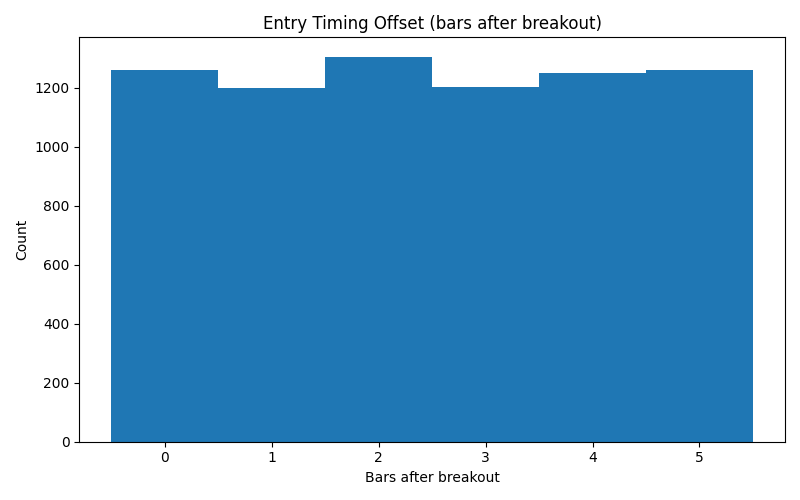
- Entries were scattered from immediately after the breakout to 5 candles later.
- The average was approx. 2.5 candles later. - No consistent entry timing existed.
In short, it is clear that discretionary trading involves entering under different conditions every time, even while believing you are seeing the same pattern.
In backtesting, such drifts are not tolerated at all.
That is why phenomena occur where:
- You were winning in live trades.
- The win rate drops in backtesting.
The win rate didn't collapse. You simply weren't making the same judgment from the start.
Those "Good at Discretion" Fall into This Trap
Ironically, experienced traders are less likely to notice this drift.
This is because:
- Only memories of winning trades remain.
- Subtle shifts in judgment don't reach conscious awareness.
- You don't question yourself as long as you are getting results.
However, backtesting involves no emotion or memory correction. When run under the same conditions, all drifts are exposed as numerical values.
While the graphs above were executed in Python, in Delver, you can output such graphs simply by entering numerical values.
Reason 2: Subconscious Filters Distorting Performance
Another major reason discretionary FX is not reproduced is the existence of "subconscious filters" that even the trader is unaware of.
"Trades Not Taken" Are Never Recorded
In discretionary trading, judgments like these are made daily:
- "The pattern is there, but it feels wrong."
- "I don't feel like I'm in sync with the market today."
- "I just lost, so I'll skip this one."
The judgment itself is not bad. The problem is that these "judgments to not enter" are not recorded.
As a result:
- Only the trades actually taken become "your performance."
- Skipped trades are treated as if they never existed.
In a backtest, however, every signal is executed mechanically. This is where the gap between discretion and verification is born.
Below is an article explaining the essence of how to read backtest results. Please take a look.
Filters Aren't Only Excluding "Low Expectancy Trades"
Discretionary traders often think:
"The trades I avoided by intuition would probably have been losses anyway."
However, when confirmed with data, the avoided trades often include those that would have won normally.
Does the Subconscious Filter Really Improve Performance?
Here, we use data to confirm: "Was it really correct to avoid those skipped trades?"
Verification Conditions
Using the same data as Reason 1, we compared skipped trades with trades actually taken.
- Currency Pair: EUR/USD
- Timeframe: 1-Hour (H1)
- Period: 2000 – End of 2024
- Target:
- Met entry conditions on a rule basis.
- However, assumed to be "skipped in discretion."
Essentially, we extracted scenarios that are entered in a backtest but would "likely be avoided by intuition" in discretion.
What We Compared
We compared the following two groups:
-
Executed Trades → Trades that are easy to actually take even in discretion.
-
Skipped Trades (Pseudo) → Met conditions on a rule basis, but likely to be skipped in discretion.
This comparison confirms whether the discretionary filter is truly excluding "only losing trades."
Were the Skipped Trades Really "Bad"?
We compared the performance of the trade group likely to be skipped in discretion against all trades.
| Category | Count | Win Rate | Avg. R | PF |
|---|---|---|---|---|
| All Trades | 7,478 | 47.9% | -0.078 | 0.93 |
| Skipped Trades | 5,983 | 48.4% | -0.089 | 0.93 |
Indeed, the average profit/loss for skipped trades deteriorated slightly.
However:
- The win rate is almost the same as the total.
- The PF is almost unchanged.
The performance is not clearly bad enough to say "it was correct to avoid them."
The Illusion Born from Subconscious Filters
In discretionary trading:
- A skipped trade that would have lost is remembered as "It was right to not enter."
- A skipped trade that would have won is not recorded or remembered at all.
As a result, an illusion that the filter is functioning is born.
However, data shows that the subconscious filter:
- Does not exclude only losing trades.
- Cuts winning trades at the same time.
This is the second reason why discretionary FX lacks reproducibility.
Why the Win Rate Breaks in Backtesting
In discretionary trading:
- Performance looks good as long as the filter is working.
- There are periods where it coincidentally fits the market.
In a backtest, since the filter does not exist:
- The number of trades increases.
- It approaches the true expectancy.
- Win rate and PF drop.
This is not a deterioration of discretionary performance. It is simply that the "parts that were invisible" during discretion have all come to light.
Discretionary Filters Cannot Be Reproduced
The biggest problem lies here:
- Which signals did you avoid?
- Why did you avoid them?
- Will you make the same judgment next time?
It is almost impossible to perfectly reproduce this. Even if you were winning with filters, the filters themselves are non-reproducible.
Reason 3: Failure to Segment Market Environments
Many cases where discretionary FX feels like it's "working" are simply fitting into a specific market environment.
You Were Only Winning in a "Certain Market"
Looking back at discretionary trades, biases are often seen, such as:
- Performance is good during strong trends.
- Losses increase in range markets.
- Winning only when there is volatility.
However, because market environments are not clearly labeled during discretion:
- Which environment were you winning in?
- Which environment were you losing in?
These remain vague.
Everything Breaks When Segmenting by Environment in Backtesting
Many scenarios where discretionary FX felt like it was "functioning" were just accidental fits to a specific environment.
During discretion, most traders do not clearly segment market environments such as:
- Trending markets.
- Range markets.
- High vs. Low volatility phases.
"Feeling Like You're Winning" Without Segmentation
When reflecting on trades in discretion, it's easy to retain impressions like "this method was working" or "I was doing well during that period."
This is because you are remembering without separating which environment you won or lost in. Winning scenes remain impressive, while losing environments are naturally forgotten.
The Story Changes When Considering Environments Separately
If you separate market environments—such as trending, ranging, or low volatility—the evaluation of discretionary trading changes drastically.
In many cases, a structure emerges where:
- You were only winning in a small subset of environments.
- In other environments, expectancy is near zero or negative.
Discretion is Slow to Notice "Environmental Changes"
In discretionary trading, awareness concentrates on immediate information such as chart patterns, candle sequences, and recent price action.
As a result, you continue the same judgments even when the market environment has quietly changed. This is not a judgment error, but a natural part of human cognitive structure.
Backtesting passes all market environments through the same rules.
That is why the phenomenon occurs where discretion won, but backtesting breaks.
The strategy isn't bad. You just didn't realize you were making environment-dependent judgments.
Reason 4: Results Converge to the Mean as Trade Count Increases
Success stories in discretionary trading are often built on a small number of trades.
Small Trade Counts Cannot Hide "Outliers"
- 7 wins out of 10 trades.
- 14 wins out of 20 trades.
At this point, you don't know if it's skill or just a fluke.
In discretion:
- Impressions of winning periods remain strong.
- You naturally reduce lot sizes or take breaks before a losing streak.
Discretionary Edge Vanishes as 'n' Increases
In backtesting:
- The number of trades increases.
- All signals are executed.
- Performance approaches the expectancy.
Performance Converges to Average as Trade Count Increases
Here, we confirmed how performance changes when executing identical trades in large volumes over a long period. The data used:
- Currency Pair: EUR/USD
- Timeframe: 1-Hour (H1)
- Period: 2000–2024
- Trade Count: Approx. 150,000
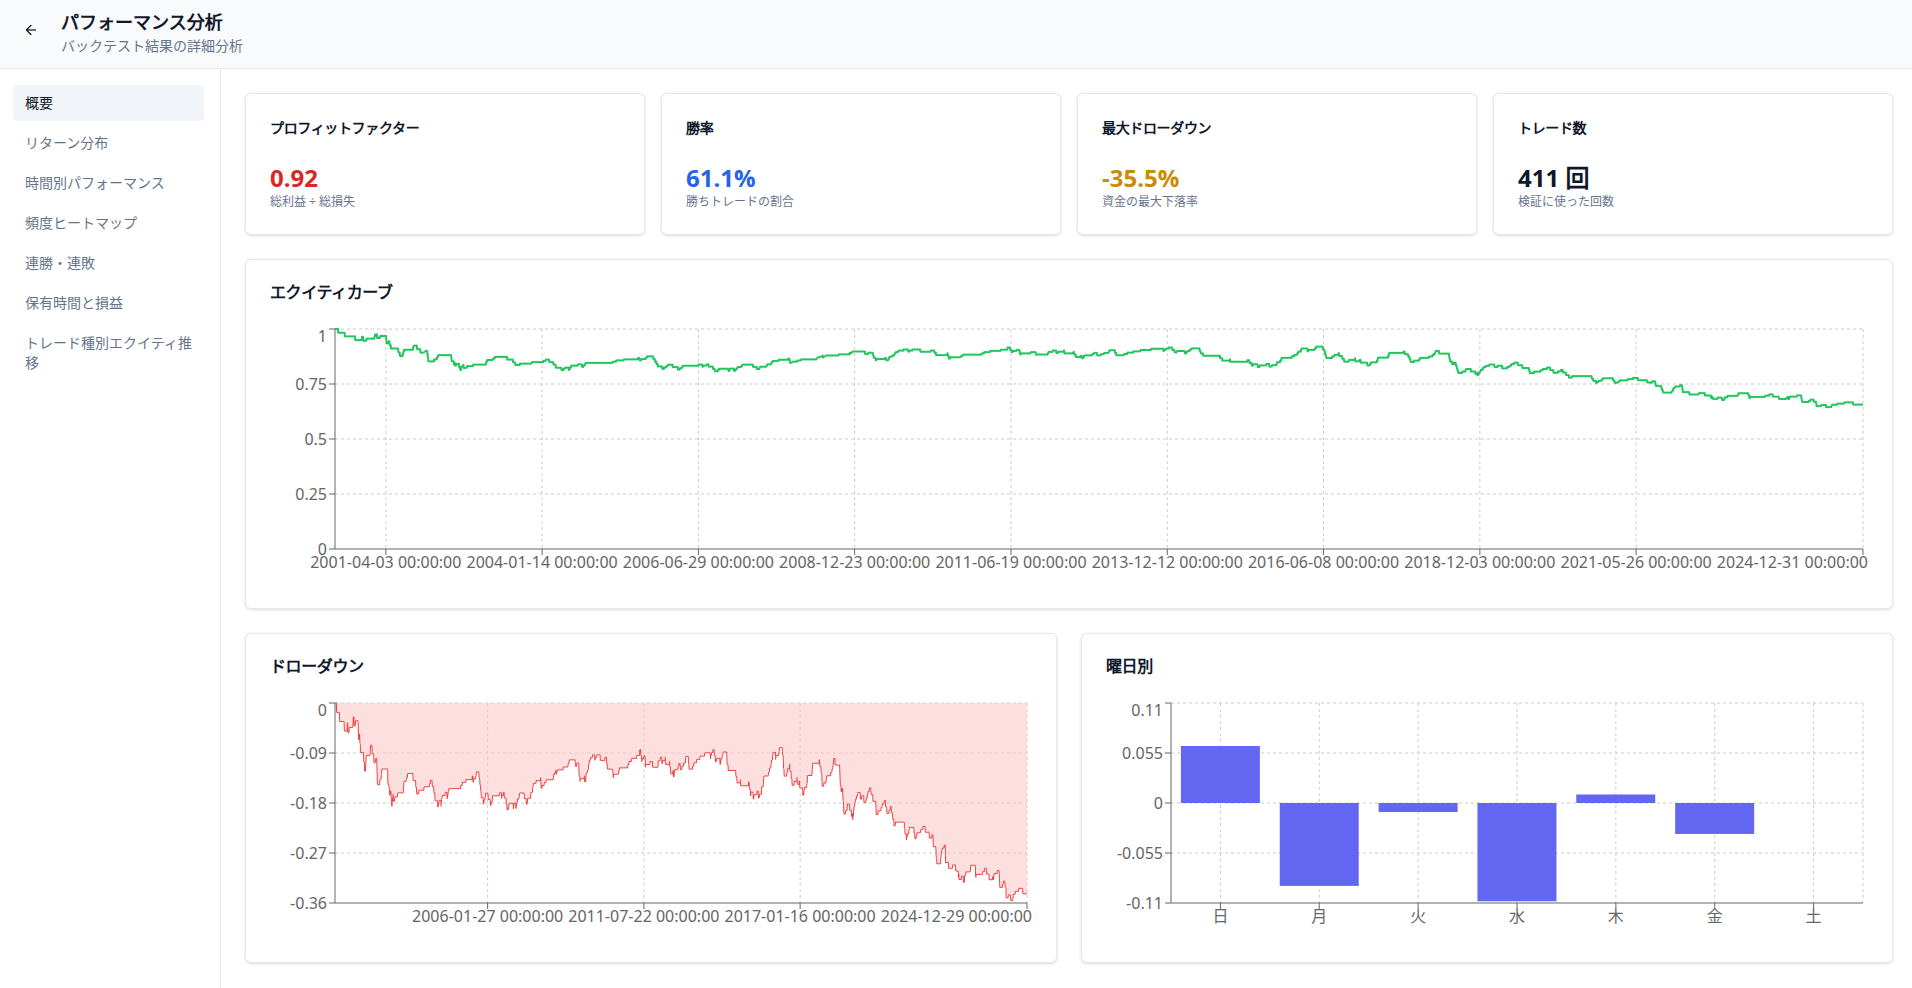
Win Rate Fluctuates "Only at the Beginning"
The graph below shows how the win rate changes as the number of trades increases.
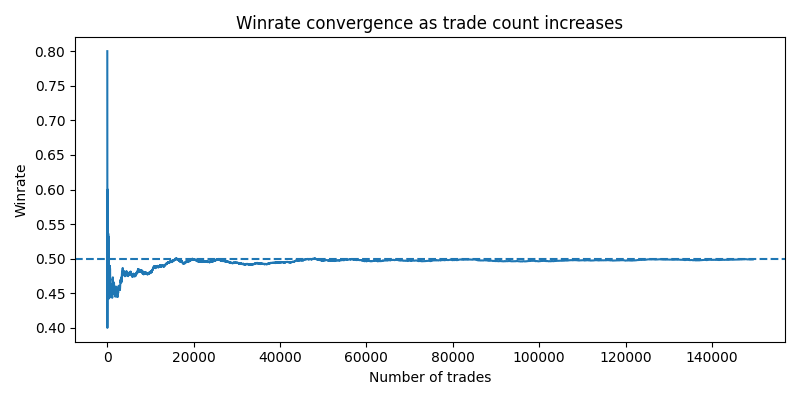
In the early stages (dozens to hundreds of trades), large fluctuations occur, such as win rates exceeding 60% or dropping to the 40s.
However, as the trade count increases:
- Win rate converges to around 50%.
- It no longer stays stably above the mean.
Cumulative Profit/Loss Also Normalizes Eventually
Next, we confirmed the cumulative profit/loss (R-based).
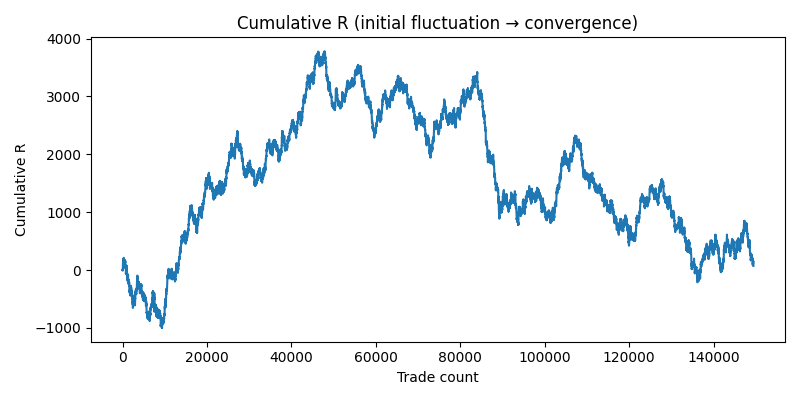
Initially, there are periods where it grows rapidly and you feel clearly "winning."
But as trades accumulate:
- Profits are gradually chipped away.
- Large trends cannot be maintained.
- It changes to a gradual transition.
This means performance is being pulled back to the statistical average.
Success in Discretion is an "Initial Outlier"
In discretionary trading, adjustments occur naturally:
- You gain confidence during winning periods.
- You drop lot sizes before losing starts.
- You rest when you feel out of sync.
Consequently, only the initial outliers remain in memory, and long-term average performance is never confirmed.
Backtesting records every trade and forcibly increases the count, bringing results closer to expectancy.
This is why the "discretion won but backtest failed" phenomenon occurs.
Discretion didn't deteriorate. The outliers simply peeled away as the trade count increased.
Reason 5: Just "Believing" It Was Reproduced
The final reason is the most overlooked and most fundamental.
Basing Everything on Past Success
Discretionary traders build rules centered on:
- Winning trades.
- Environments where they did well.
- Memories of good judgments.
However, when applied to:
- Different periods.
- Different markets.
- Different volatility environments.
The results do not match.
Fails When Run in Different Periods Under Same Conditions
We quantified discretionary rules and conducted backtests without any changes:
- Adjusted on Period A (Historical data).
- Verified on Period B (Subsequent data).
We used EUR/USD (H1) long-term data divided into an adjustment period (In-sample) and a verification period (Out-of-sample).
The results are below:
| Category | Trade Count | Win Rate | Avg. R | PF |
|---|---|---|---|---|
| In-sample (Adjustment) | 89,675 | 49.7% | +0.012 | 1.01 |
| Out-of-sample (Verification) | 59,784 | 50.2% | -0.017 | 0.98 |
In the adjustment period, it appears to be "functioning as a rule" with a positive average R and PF above 1.0.
However, when the same rule is applied to a different period:
- Average R falls into the negative.
- PF drops below 1.0.
This isn't because the rule suddenly deteriorated or the market changed extremely.
It simply means it only "looked good" because it was fitted to past data, and it was not a reproducible edge.
"Believing You Reproduced It" is Most Dangerous
Discretionary traders tend to build rules based on past successes and hand-picked memories.
But in most cases, it wasn't being reproduced; it just happened to fit coincidentally. If it collapses in a different period under the same conditions, it cannot be called "reproducible."
Decisive Difference Between Reproducible and Non-Reproducible Discretion
By organizing the five reasons above, the difference becomes clear.
Non-Reproducible Discretion
- Vague judgment criteria.
- Reliance on subconscious filters.
- No segmentation of market environments.
- Based on success stories of few trades.
- No verification that works in different periods.
Reproducible Discretion
- Judgments defined numerically.
- Few exception handling cases.
- Expectancy understood by environment.
- Verified with sufficient trade counts.
- Confirmed under same conditions in different periods.
Minimum Steps if You Continue Discretionary FX
You don't need to deny discretion. But a premise of doubt is necessary.
- Look at distributions, not win rates.
- Always re-verify under same conditions/periods.
- Treat discretion as something that "drifts."
In any case, backtesting is a crucial process for providing reproducibility to any method, whether it be discretion or automated trading.
The articles below introduce free backtesting tools and how to conduct backtests.