Have you ever seen backtest results boasting a "90% Win Rate" or a "3.0 PF" and thought to yourself:
"This has to be an incredibly strong strategy."
In this article, we will ruthlessly dismantle why that intuition is dangerous by analyzing the relationship between win rates, PF, equity curves, and drawdown.
Why "High Win Rate" Strategies are Often the Most Dangerous
Bankruptcy Occurs Even with Positive Expectancy
Win rate is simply "Number of Wins ÷ Total Number of Trades." It contains zero information regarding when those losses occur or if losing streaks cluster together.
In other words, win rate is a metric that completely ignores sequence.
You can gain a deeper understanding by reading Why You Lose Despite a 60% Win Rate along with The Probability of Ruin for Traders Who Ignore Max Drawdown.
The Illusion Created by Short-Term Backtests
Take a look at the following equity curve:
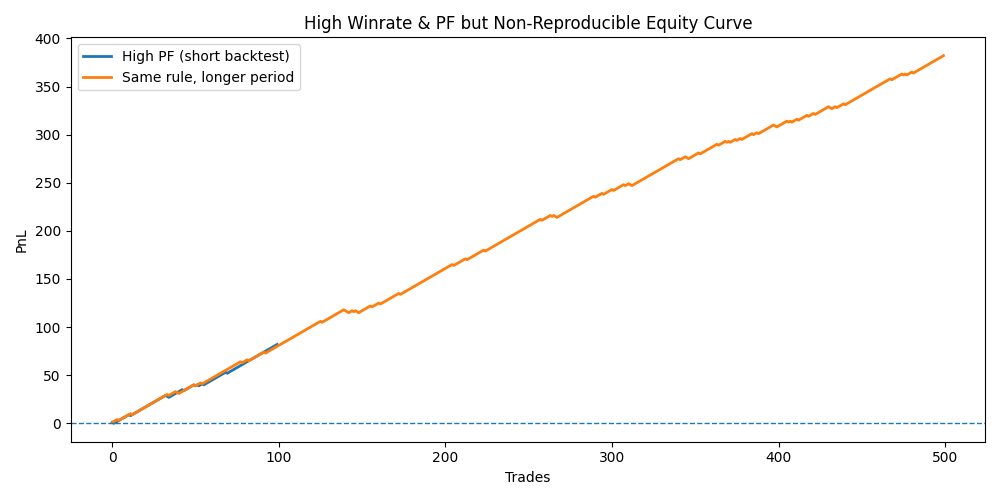
- Blue Line: Short-term backtest (100 trades).
- Orange Line: The same rules applied over a longer period.
While it looks "perfect" in the short term, extending the period reveals that it was merely an illusion of steady growth. At this stage, it's not that the strategy is superior; it’s just that no major "accidents" have happened yet.
The Real Reason Profit Factor (PF) is Untrustworthy
PF is an "Average" and Ignores Distribution
PF is calculated using the following formula:
PF = Total Gross Profit / Total Gross Loss
While it seems logical, this metric completely ignores the shape of your profit and loss.
- Are wins distributed evenly?
- Is there a single, massive outlier win?
- Are losses clustered together?
None of this can be deciphered from PF alone.
A Single Outlier Can Corrupt Your PF
Look at the graph below:
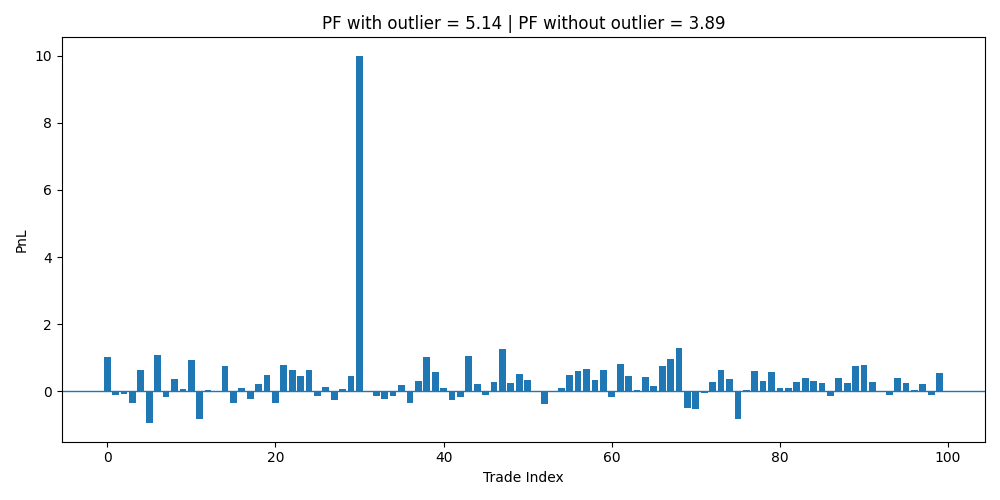
- Most trades are small wins or losses.
- A single massive win is artificially inflating the PF.
Remove that one trade, and the PF becomes something entirely different. The assumption that High PF = Stability is a complete fallacy.
High Win Rate and PF $\neq$ Safety
PF Does Not Correlate with Maximum Drawdown
Here is a scatter plot mapping multiple strategies:
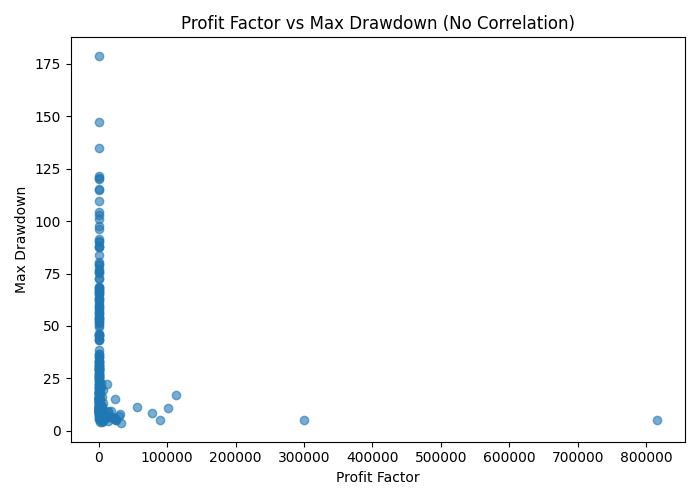
- Horizontal Axis: PF
- Vertical Axis: Maximum Drawdown (Max DD)
As you can see, there are plenty of strategies with high PF that carry massive drawdowns. In short:
High PF $\neq$ Capital Stability.
What You Should Really Watch: "DD Distribution"
Simply looking at a single Max DD value is insufficient.
- Average DD: Almost meaningless.
- Max DD: Often influenced by luck.
What you really need to look at is the distribution itself: "What level of DD occurs, and with what probability?"
This article explains how to interpret various trade results in detail:
Curve Fitting: The Art of Creating "Perfect Numbers"
Why Win Rate and PF are Easy to Over-Optimize
Win rate and PF are the metrics most prone to curve fitting because:
- They can be boosted by slightly tweaking parameters.
- They can be perfectly tailored to a specific historical period.
- They can exist without any consideration for market structure.
You must always ask: Is the strategy capturing market behavior, or is it just matching past noise?
What are the Truly Reliable Verification Metrics?
Does it Survive if You Break the Sequence?
- Does the strategy hold up if you shuffle the trade order?
- Can your capital survive a Monte Carlo simulation?
Verification that lacks this perspective is not a verification of reproducibility.
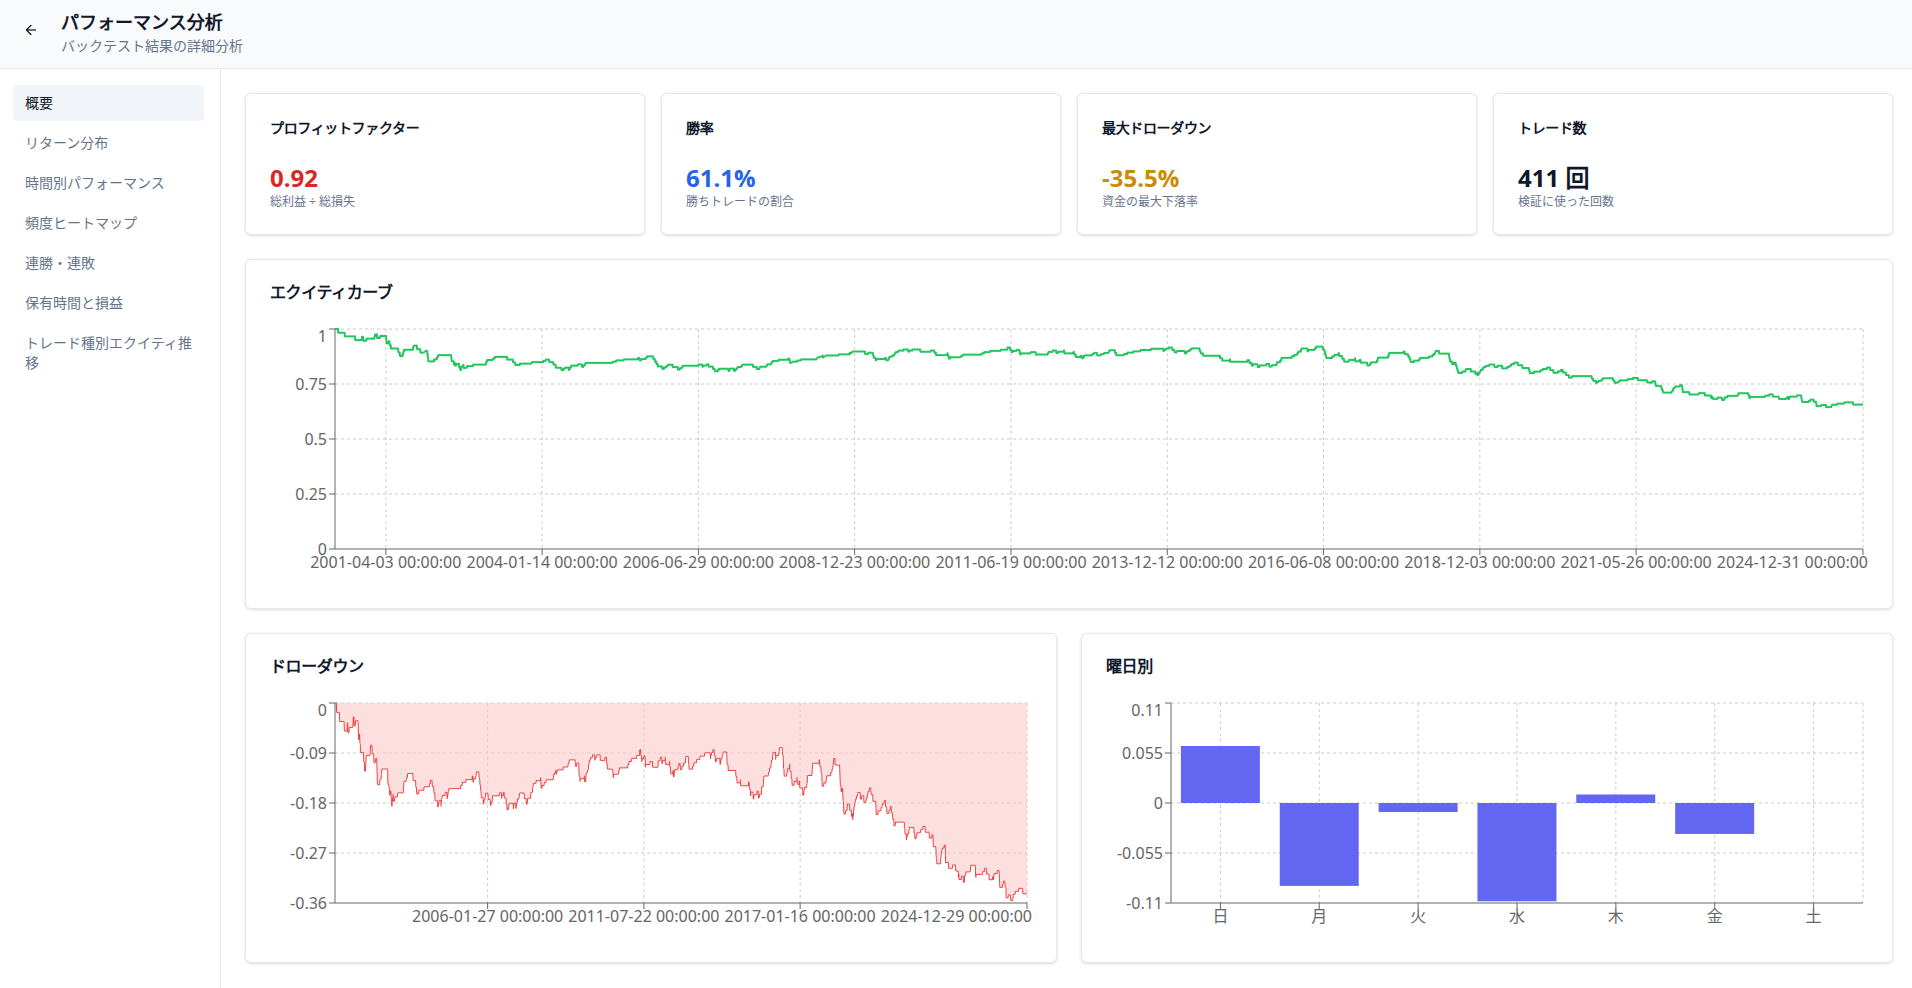
Using Delver, you can instantly visualize your true performance by excluding single outliers and viewing detailed DD distributions that PF hides. Check for free right now if your strategy is just a "paper tiger" made of hollow numbers.
Money Management IS the Strategy
If you only look at entry conditions, your verification isn't even half-finished.
- Risk percentage
- Expected DD
- Recovery period required
Only when these are included do you have a "usable strategy." To find these entry conditions, a proper tool is essential. Check out our summary of free backtesting tools:
Summary | As Long as You Trust Win Rate and PF, Reproducibility is Out of Reach
Bankruptcy is a Design Flaw, Not Bad Luck
Thinking "It's safe because the win rate is high" or "It's excellent because the PF is good" is the fastest route to bankruptcy.
Tools like the "Risk of Ruin" calculator can help you verify your survival chances easily. Try calculating yours here:

Survival Strategies Look at "Distributions"
Look past the clean numbers and focus on the messy reality:
- How deep will it sink?
- How much can I actually endure?
- What is the probability of that happening?
Unless you face these questions, no number is worth trusting.
Would you like me to analyze a specific set of trade logs to see if your current PF is being carried by an outlier?