なぜ「期待値プラス=儲かる」は嘘になるのか
トレードの世界では、
「この手法は期待値がプラスです」
という言葉が、まるで勝利宣言のように扱われます。
しかし現実には、
期待値がプラスでも資金が減り続ける期間は普通に存在します。
これは例外ではなく、
確率構造上、必然的に起こる現象です。
期待値は「平均」の話でしかない
期待値とは、
無限に試行したときの平均値です。
個人トレーダーが直面するのは、
- 有限回のトレード
- 限られた資金
- 限られた精神的耐久力
この制約の中では、
平均に収束する前に脱落するケースが大半です。
今回の記事の前提として、まず勝率やDDを知る必要があります。
それらを手軽に知るツールはこちらでまとめております。
個人トレーダーは平均に到達する前に脱落する
期待値は長期の話。
破綻は途中経過の話。
このズレを理解しない限り、
「理論上は勝てるのに、現実では負ける」
という矛盾から抜け出せません。
期待値と資産曲線はまったく別物である
期待値が同じでも資産曲線は無限に存在する
同じ勝率・同じRRを持つ手法でも、
資産曲線の形は無数に存在します。
なぜなら、
トレード結果の並び順が固定されていないからです。
順序(トレードの並び)が結果を支配する理由
勝ちが先に来るか、
負けが先に来るか。
それだけで、
- 途中のドローダウン
- 精神的負荷
- 継続可否
は大きく変わります。
資産曲線の「バラツキ(分散)」とは何か
分散が大きい手法ほど「見た目が荒れる」
分散とは、
トレード結果がどれだけ散らばるか、という性質です。
分散が大きい手法ほど、
- 大勝ちもある
- 大負けもある
- 資産曲線は激しく上下する
という特徴を持ちます。
ボラティリティは価格だけでなく資産曲線にも存在する
多くの人は、
ボラティリティ=価格の話
だと思っています。
しかし実際には、
資産曲線そのものにもボラティリティがある。
そして、
トレーダーを壊すのは価格ではなく、
資産曲線のボラティリティです。
期待値プラスでも「資金が減り続ける期間」が必ず生まれる
短期的なマイナスは異常ではない
期待値プラスの手法でも、
- 数十回
- 数百回
負け続ける期間は普通に発生します。
これは異常事態ではありません。
問題は「どれくらいの長さで続くか」
致命的なのは、
その期間を想定せずに
資金管理やメンタルを設計していること
です。
【可視化】同じ期待値を持つ資産曲線は、ここまで違う
モンテカルロ・シミュレーションの前提条件
以下は、
期待値が同じ2つの手法をシミュレーションした結果です。
違うのは、
トレードごとの損益のバラツキ(分散)だけです。
右肩上がりと破綻が同時に存在する理由
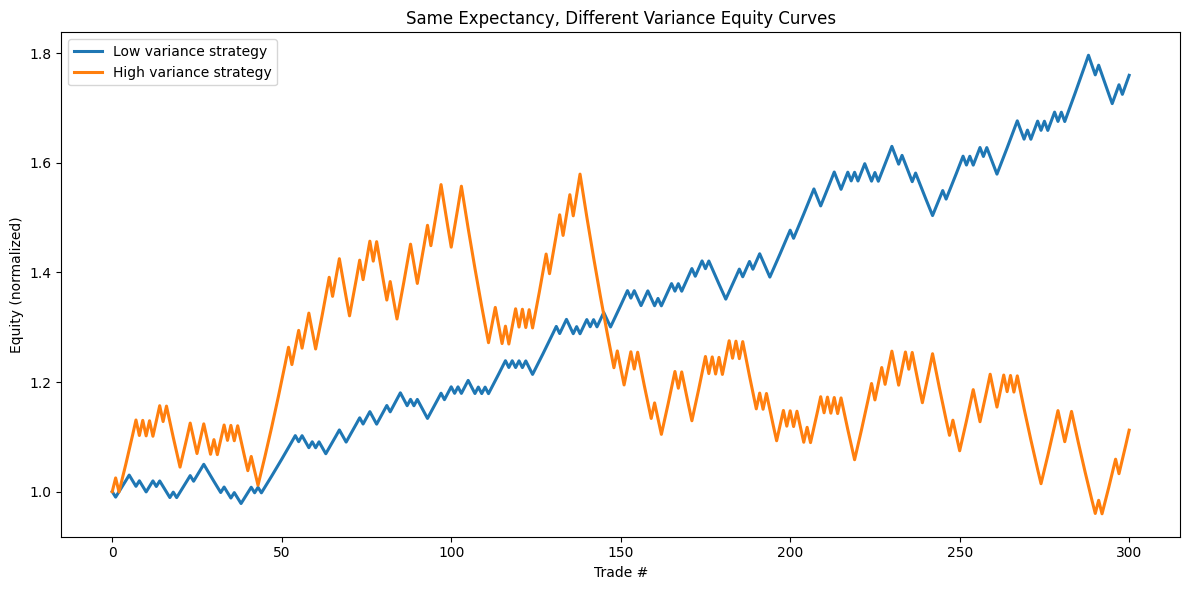
最終的な期待値は同じでも、
- 青線:比較的穏やかに推移
- 赤線:激しく上下し、途中で耐えがたい局面が発生
あなたが感じる苦しさは、期待値ではなく分散で決まります。
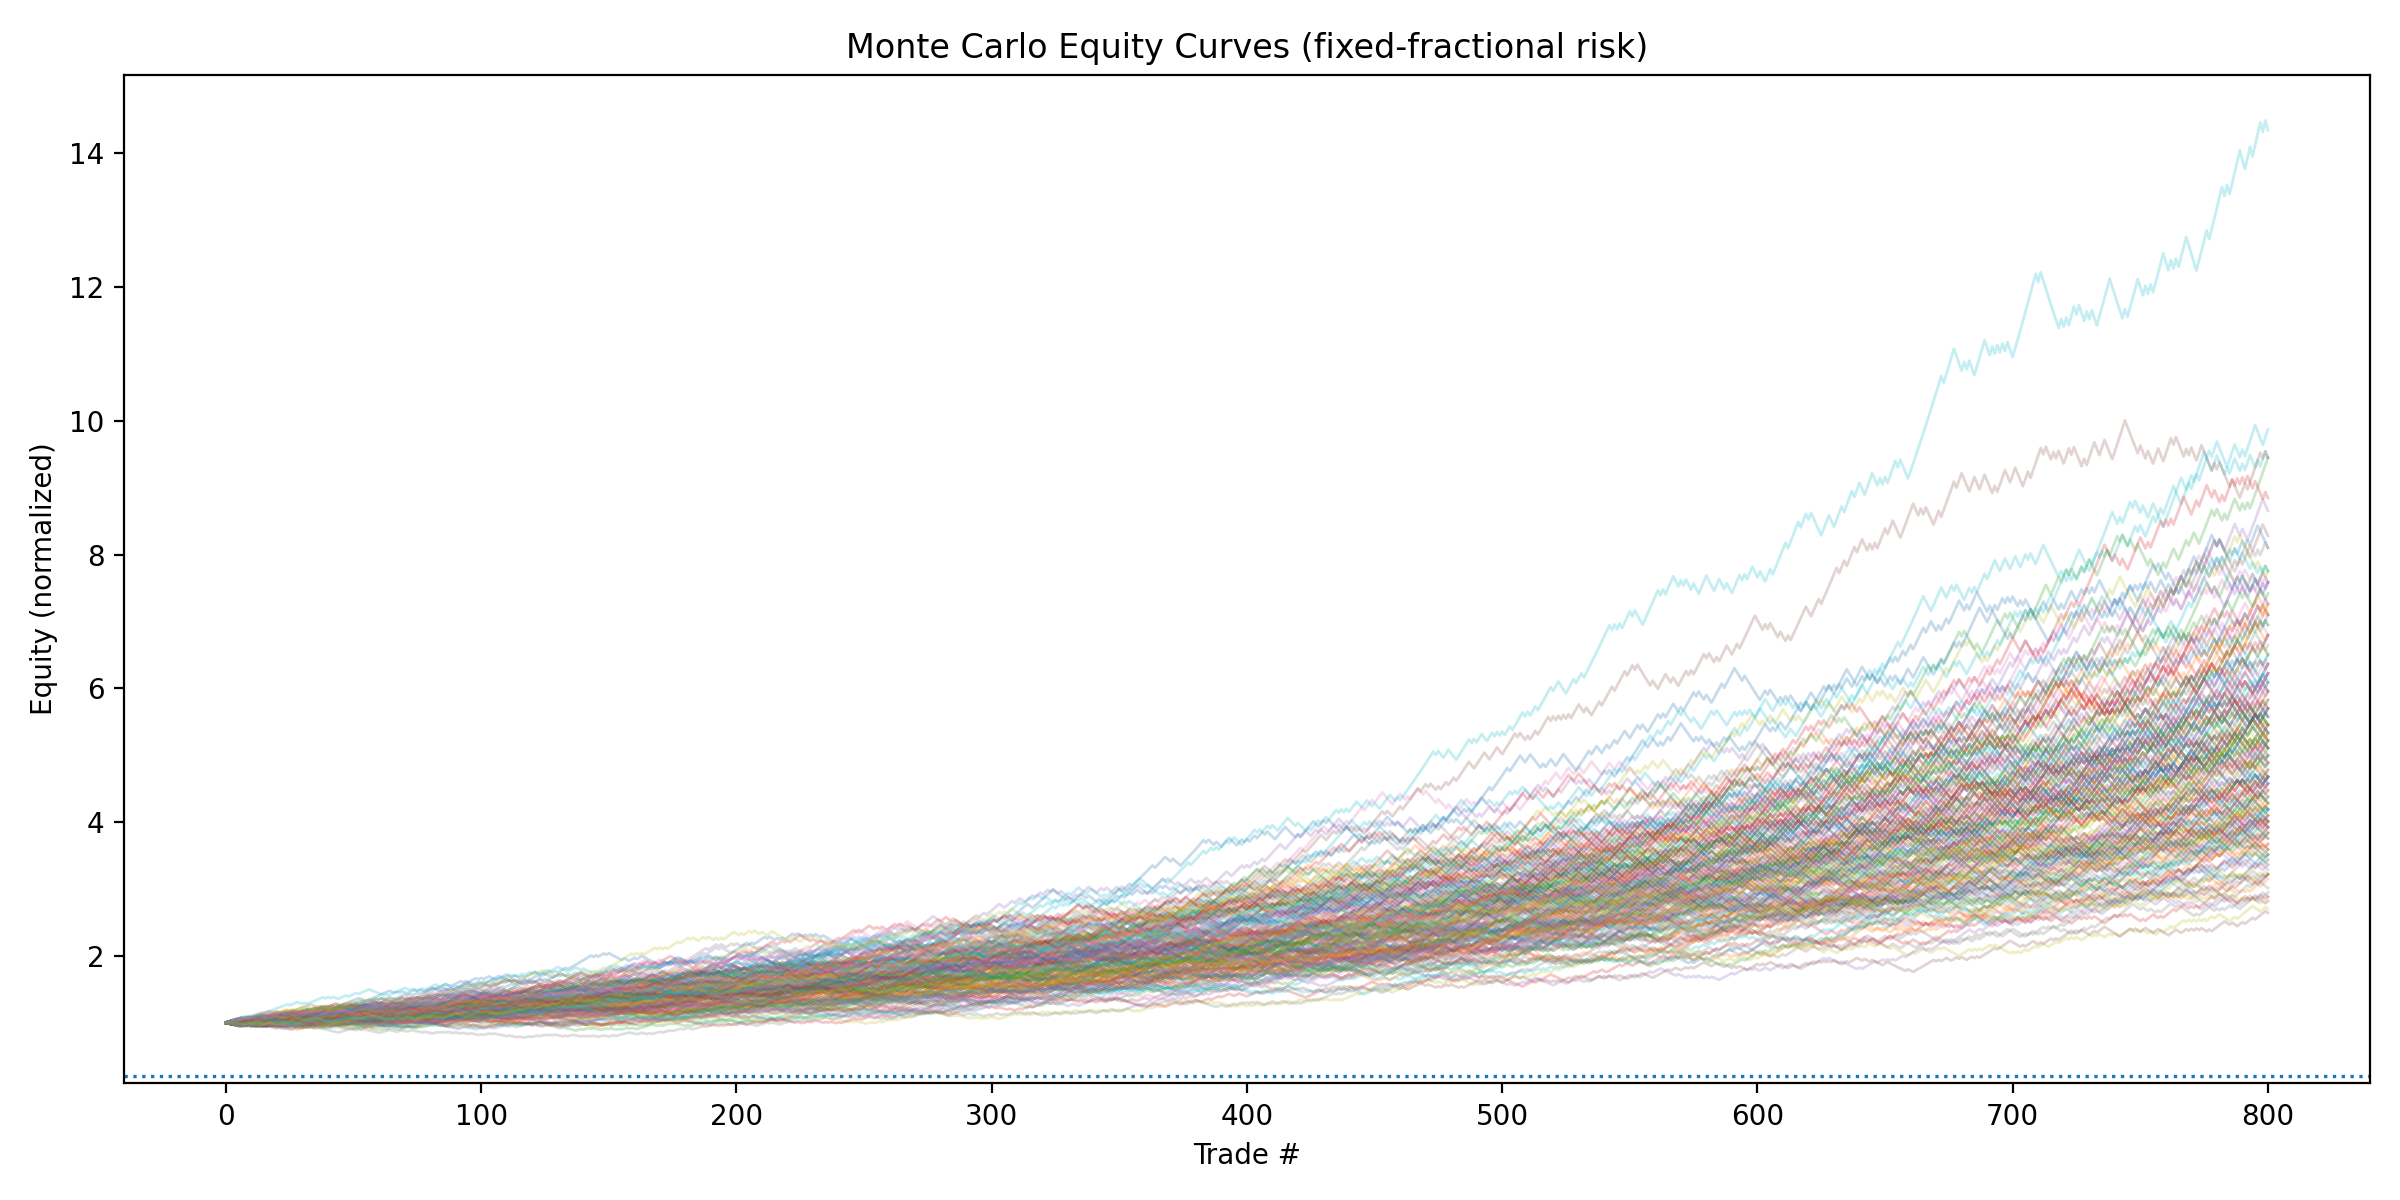
なぜ多くの検証で資産曲線のバラツキが無視されるのか
1本の資産曲線しか見ていない問題
多くの検証は、
- 1回のバックテスト
- 1本の資産曲線
で終わります。
しかしそれは、
無数にある可能性の中の1本にすぎません。
「最終損益」だけで判断してしまう心理
人は、
最後に勝っていれば正解だと思いがちです。
途中で耐えられなかった可能性は、
検証から消えます。
【並び順の暴力】同じトレード結果の「シャッフル」比較
以下は、
全く同じ100回のトレード結果を
順番だけ入れ替えた資産曲線です。
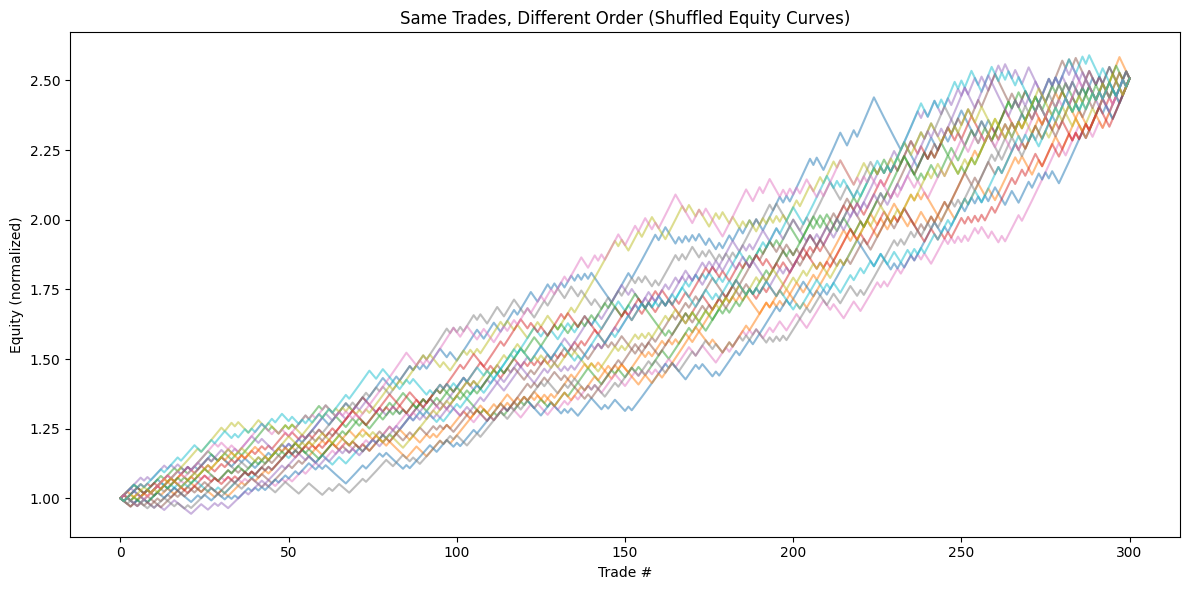
最終損益は全員同じ。
しかし、
- 最大ドローダウン
- 途中の心理的負荷
は、全員バラバラです。
今あなたが負けている理由が、
手法ではなく「順番」だけという可能性は、
十分にあります。
以下ではドローダウンの重要性についても解説しています。
期待値よりも先に見るべき指標
分散・標準偏差・下振れリスク
期待値を見る前に、
- 分散
- 標準偏差
- 下振れの深さと長さ
を見る必要があります。
期待値とリスクは必ずセットで評価する
期待値だけを見るのは、
ブレーキのない車を評価するようなものです。
以下の記事では、実データとグラフでどのように結果を見ればいいのか?を詳しく解説していますので、あわせてご覧ください。
資産曲線のバラツキがトレード判断を壊す瞬間
途中のマイナスがルールを歪める
長い停滞期は、
- エントリーを疑わせ
- ロットを変えさせ
- ルールを破らせます
「期待値を信じきれない状態」が最大の敵
理論を信じられなくなる瞬間、
トレードは統計ではなく感情になります。
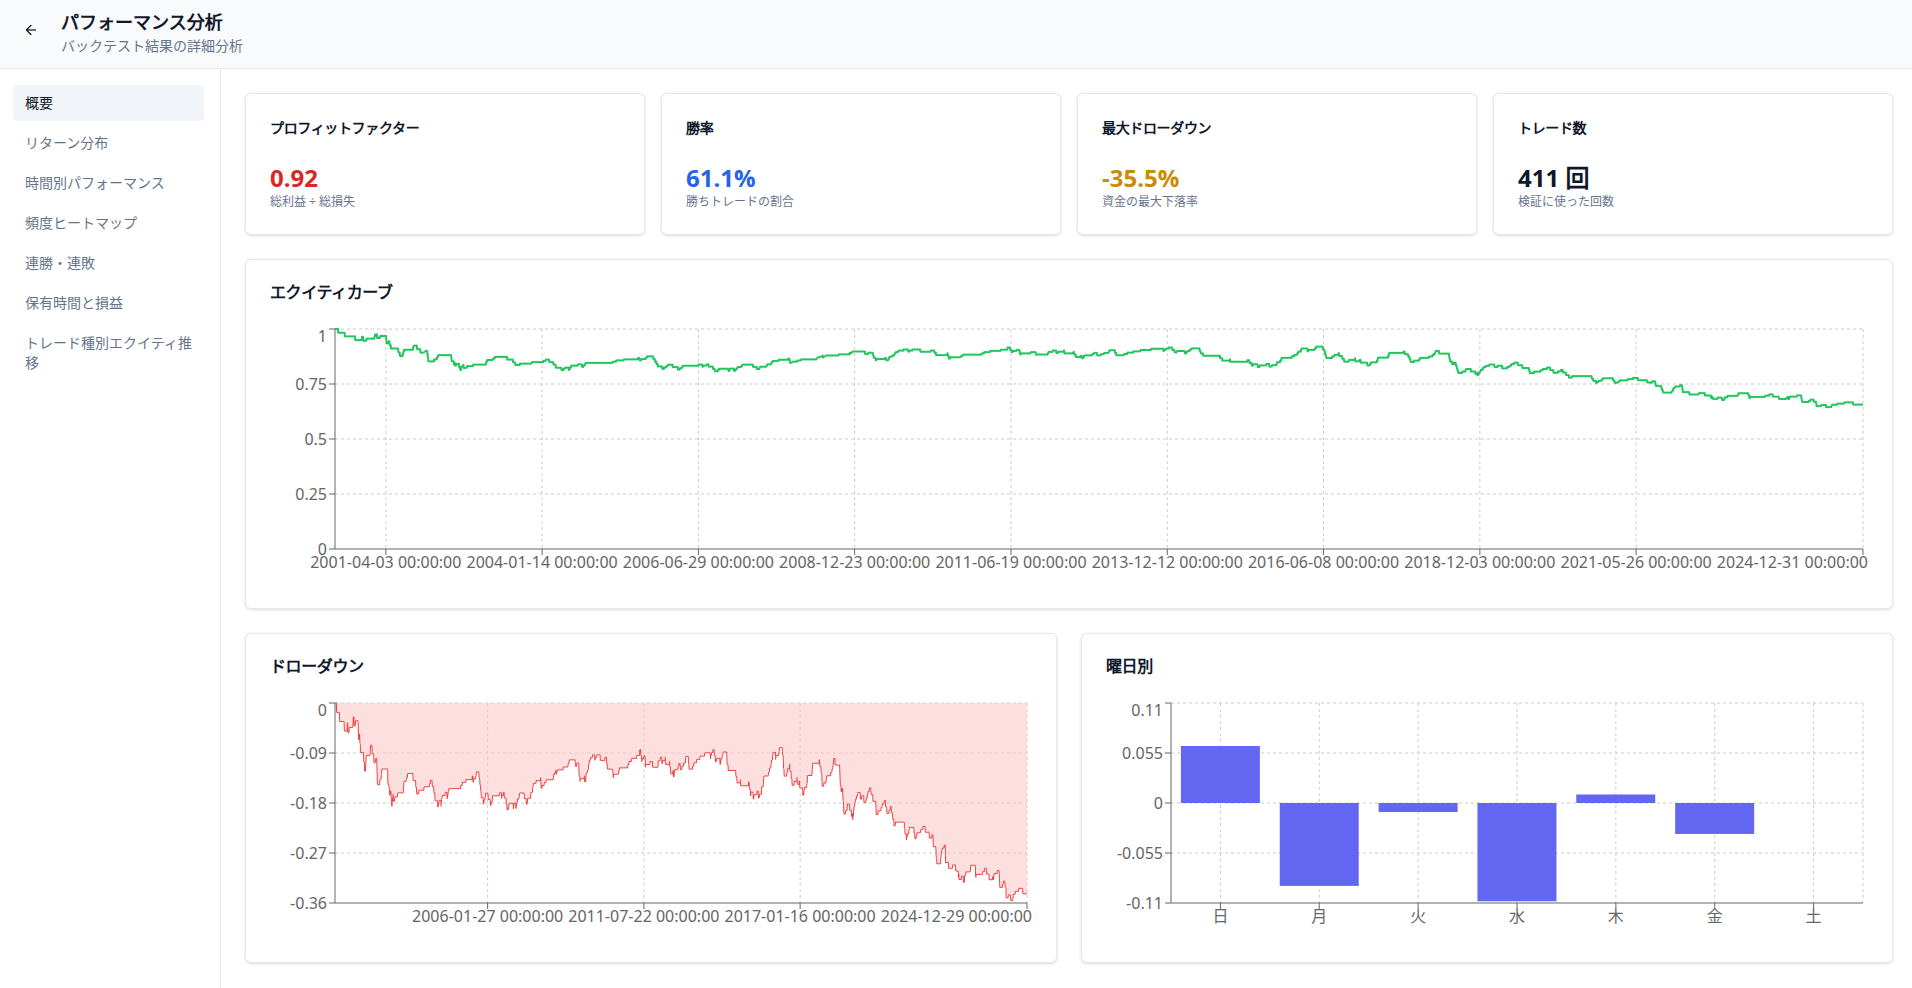
【停滞期の現実】アンダーウォーター・チャート
次は、
「どれだけの時間、最高値を更新できていないか」
だけを見たグラフです。
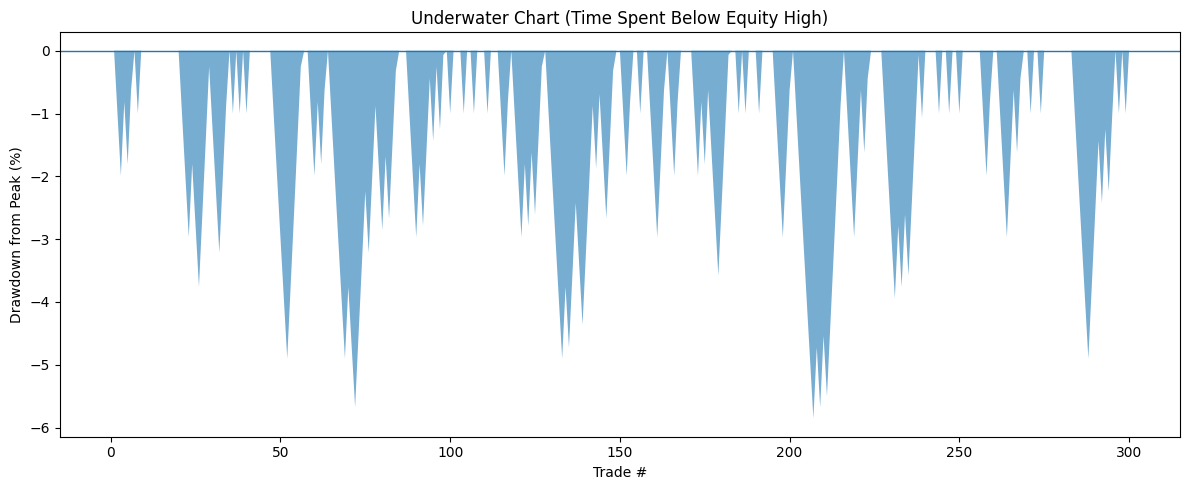
期待値プラスの手法でも、
**大半の時間は“勝っている実感のない期間”**にあります。
検証で本当に確認すべきポイント
複数パスで資産曲線を見る
1本の結果ではなく、
複数の可能性を見る。
それが検証です。
最悪ケースを前提に資金管理を組む
「たぶん大丈夫」ではなく、
「最悪でも耐えられるか」で設計する。
期待値や分散以前に、検証のやり方そのものが間違っているケースも少なくありません。
検証してるのに勝てない理由3選|9割がやっている手動検証の致命的ミスでは、再現性がありリアルトレードに近い設定を紹介しています。
まとめ|期待値プラスは「条件付き」でしか意味を持たない
期待値はゴールではなく前提条件
期待値は、
スタートラインに立つための条件にすぎません。
生き残れない期待値に価値はない
耐えられない分散を持つ期待値は、
机上の空論です。
トレードで問われるのは、
勝てるかではなく、
生き残れるかです。
次に理解するべきテーマは勝率とPFの罠|数字の裏に隠れた「カーブフィッティング」を見抜くです。
自分の手法が生き残れるかをDelverで確認する
期待値プラスでも分散が大きければ口座は崩れます。Delverでは25年分の連敗パターンと資産曲線のバラつきを可視化できます。「生き残れる設計か」を数字で確認してみてください。
タップして詳細を確認