"RSI tells you when the market is overbought or oversold — it's the ultimate indicator."
If you still believe that, I won't mince words: stop reading this page and quit FX trading right now.
I slammed over 10,000 RSI parameter combinations against EURUSD market data spanning 2000 to 2025 — a full 25 years of history. RSI period × oversold threshold × overbought threshold yielded 11,466 configurations. Multiplied by 400 TP/SL combinations, the total number of cases computed reached 4,586,400.
The conclusion from all of that is singular:
There is not a single shred of a "Holy Grail" in RSI mean reversion.
The popular wisdom — "Buy below 30, sell above 70 and let mean reversion do the work" — has been reduced to pathetic rubble before the weight of 25 years and the judgment of statistics.
Many traders feel that RSI doesn't work, and this article puts that feeling into hard numbers.
The Scope of This Study
In this study, we investigate whether RSI mean reversion actually wins over the long term.
The method is Brute Force Verification.
When RSI crosses below the oversold threshold → Long entry. When RSI crosses above the overbought threshold → Short entry. Exit at specified TP/SL. That's it. We apply this simple logic across every conceivable parameter combination.
"We look for anomalies — edges in the data — and exploit them." — Jim Simons (Renaissance Technologies founder), TED Interview
"Investing is a scientific process — continuously testing thousands of hypotheses through rigorous data analysis." — Two Sigma (The Innovation Equation)
This study uses the exact same data source and conditions as our Bollinger Bands brute force backtest, making direct comparison possible.
First: Testing the Common Settings
Let's start with what the textbook recommends, run through Delver, a free backtesting tool.
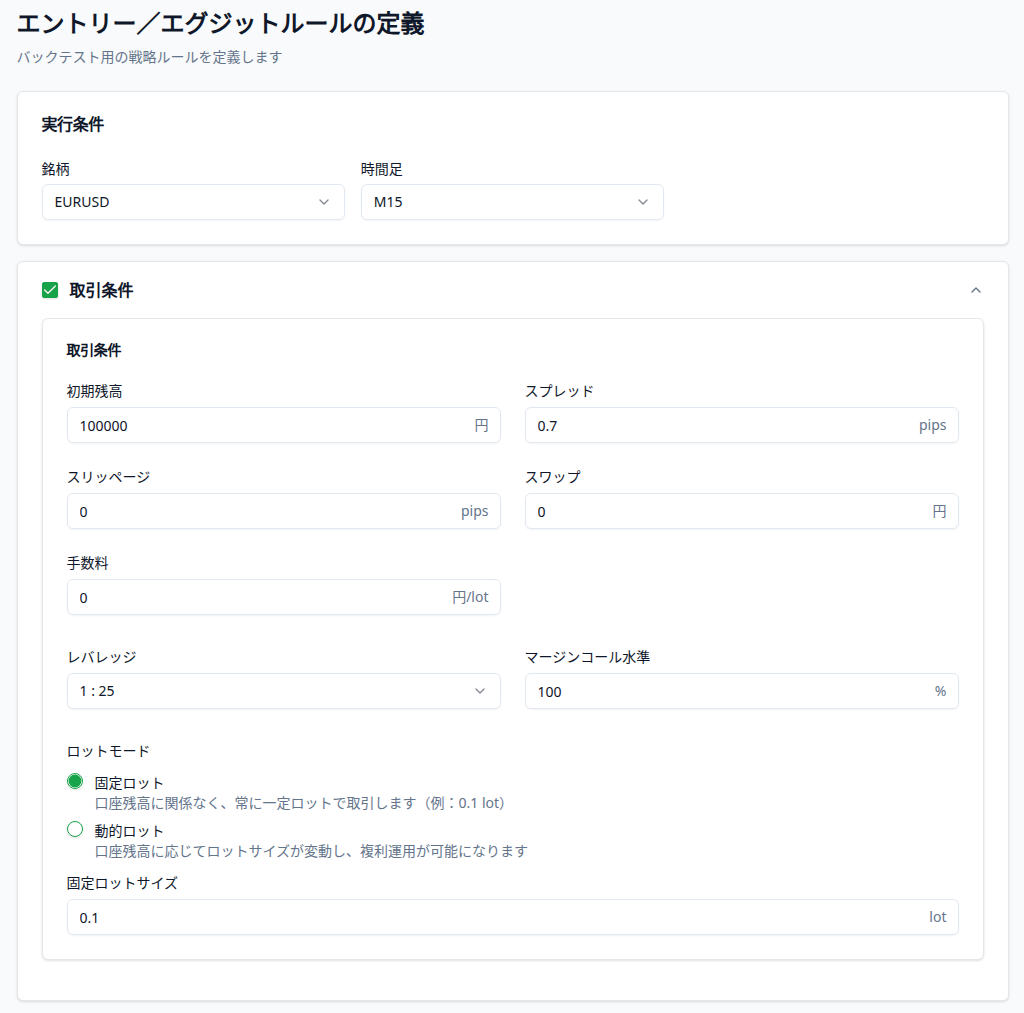
Test Conditions
-
Instrument / Timeframe: EURUSD M15
-
Spread: 0.7 pips
-
Slippage and swap: Disabled
-
Leverage: 25x
-
Risk management: Fixed lot (testing the strategy, not position sizing)
RSI Settings
The most popular configuration: RSI period 14, oversold at 30, overbought at 70.
Entry logic is straightforward:
- Long: RSI crosses below the oversold threshold (30)
- Short: RSI crosses above the overbought threshold (70)
- Exit: TP20 pips / SL20 pips (RR 1:1)
5-Year Results
Looking at 2020–2025 first:
- Expectancy: -0.818 pips/trade — Losing more than 0.8 pips on every single trade, consistently.
- Trade count: 3,356 — All those entries over 5 years and still solidly negative throughout.
This is just one data point. Jumping to conclusions here would be a mistake — as the holy grail myth article explains. Maybe the TP/SL settings were wrong. That's our next hypothesis.
The Exit Condition Hypothesis
The previous test locked TP and SL at 20 pips each (RR 1:1). But what if that was the problem?
RSI just caught an oversold reading — shouldn't we let profits run further? Or maybe tighten the stop and aim for a higher win rate?
Countless hypotheses emerge. Let's test them all at once.
Brute Force Testing with Python
Delver can run these tests, but with 10,000+ combinations we turned to Python for efficiency.
Full Test Scope
-
Entry logic: RSI crosses below OS threshold → Long; crosses above OB threshold → Short
-
RSI period: 5–30 (step 1, 26 values)
-
Oversold threshold: 20–40 (step 1, 21 values)
-
Overbought threshold: 60–80 (step 1, 21 values)
-
Take Profit (TP): 5–100 pips (step 5, 20 values)
-
Stop Loss (SL): 5–100 pips (step 5, 20 values)
-
Test period: 5 years (EURUSD M15, 2020–2025)
-
RSI configurations: 11,466
-
Total combinations including TP/SL: 4,586,400
-
Spread and costs: Same as Delver conditions (0.7 pips)
Results
The results were striking.
Expectancy Distribution
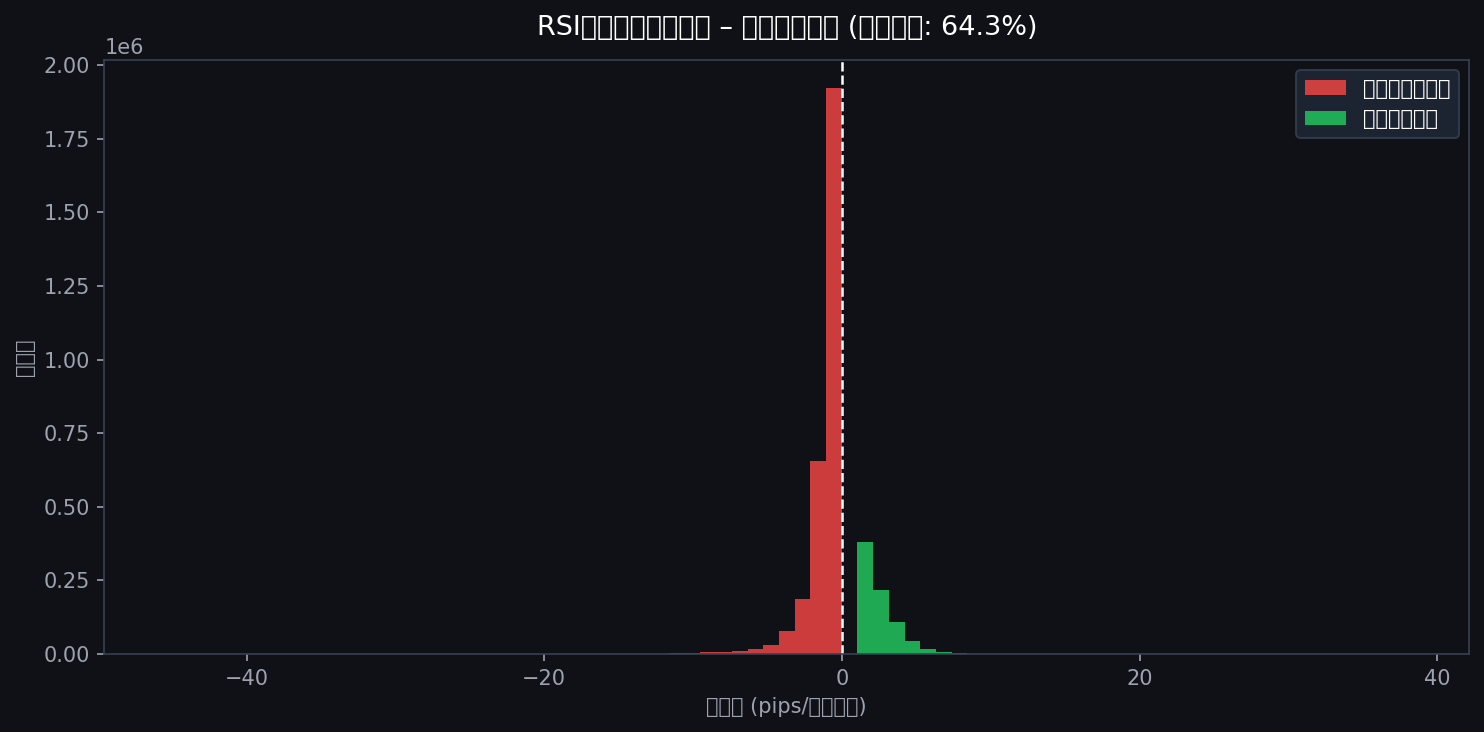
Of 4,586,400 cases, 64.3% had negative expectancy. Only 35.7% were positive.
That looks slightly better than Bollinger Bands — but hold on. We're about to find out whether that 35.7% is real.
TP × SL Expectancy Heatmap
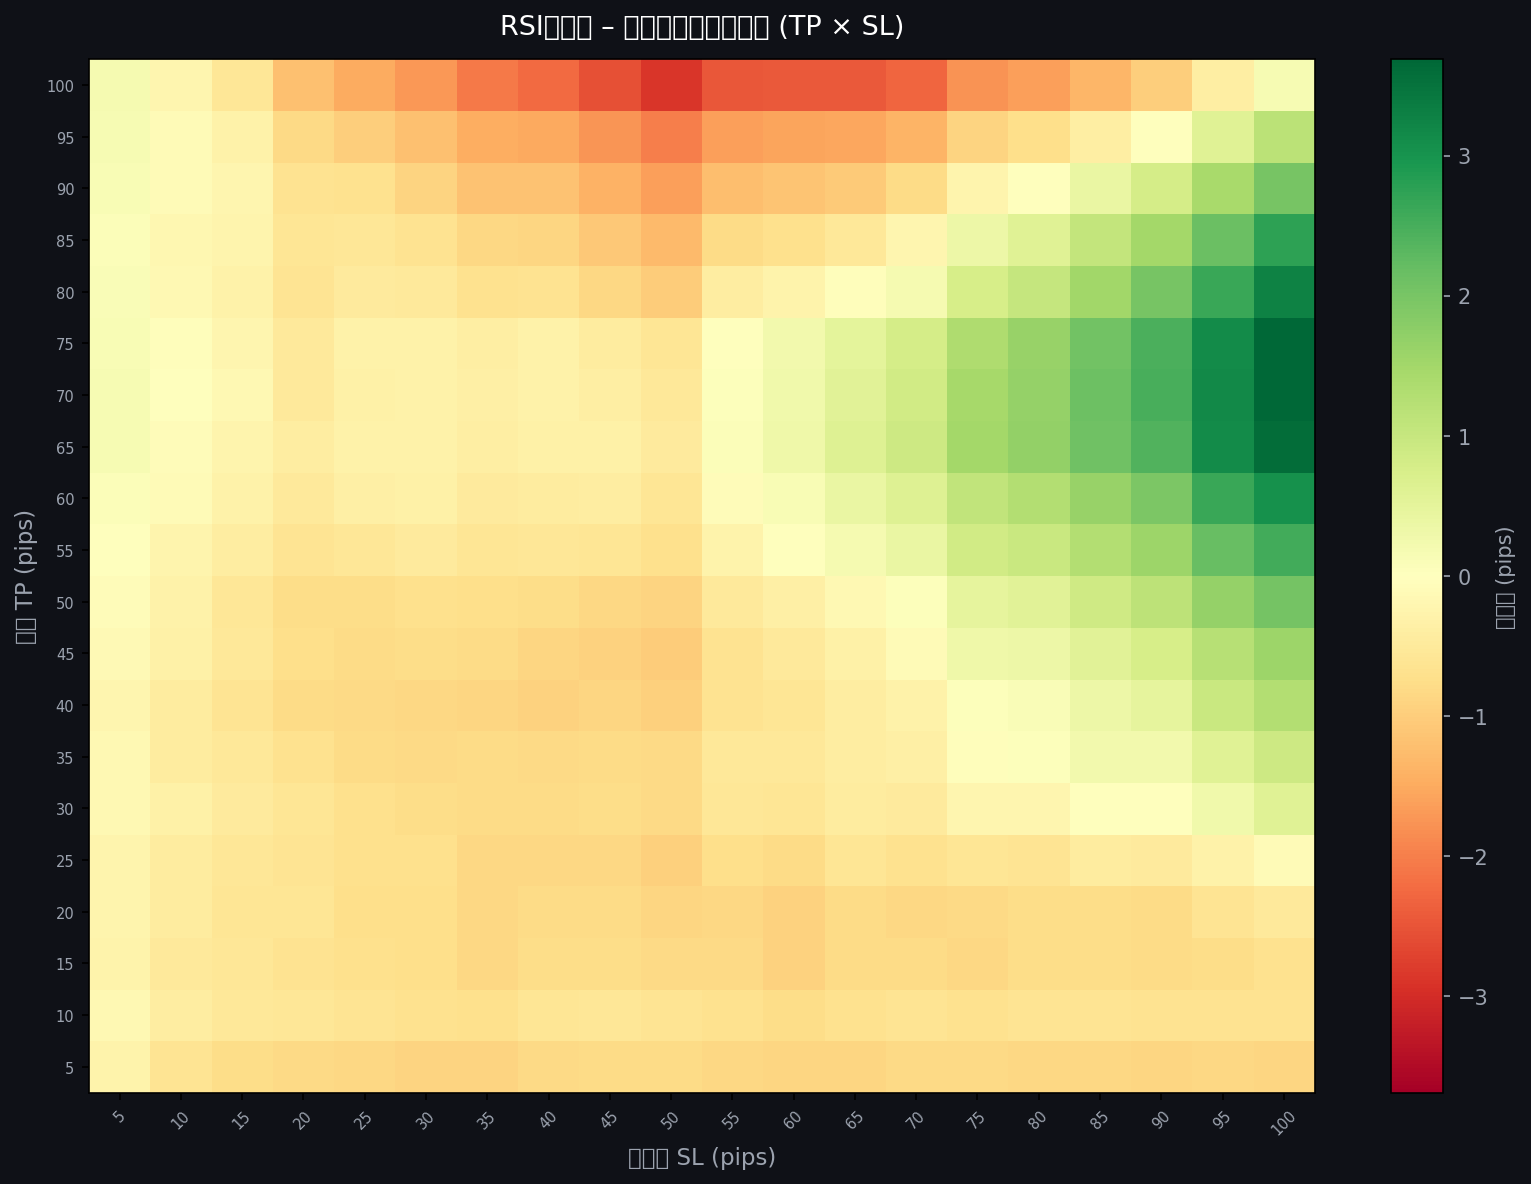
Most of the map is dominated by blue and purple — the colors of death.
There is a faint green glow in the upper-right corner: large TP + large SL combinations where expectancy turns positive.
In other words, only extreme high-RR settings show a positive edge.
But don't be fooled.
A large TP means longer holding time — and more time for spread costs to accumulate.
Drawdown Heatmap
Drawdown is one of the most critical factors in any backtest. The holy grail myth lives in high-DD settings that look great until they destroy an account.
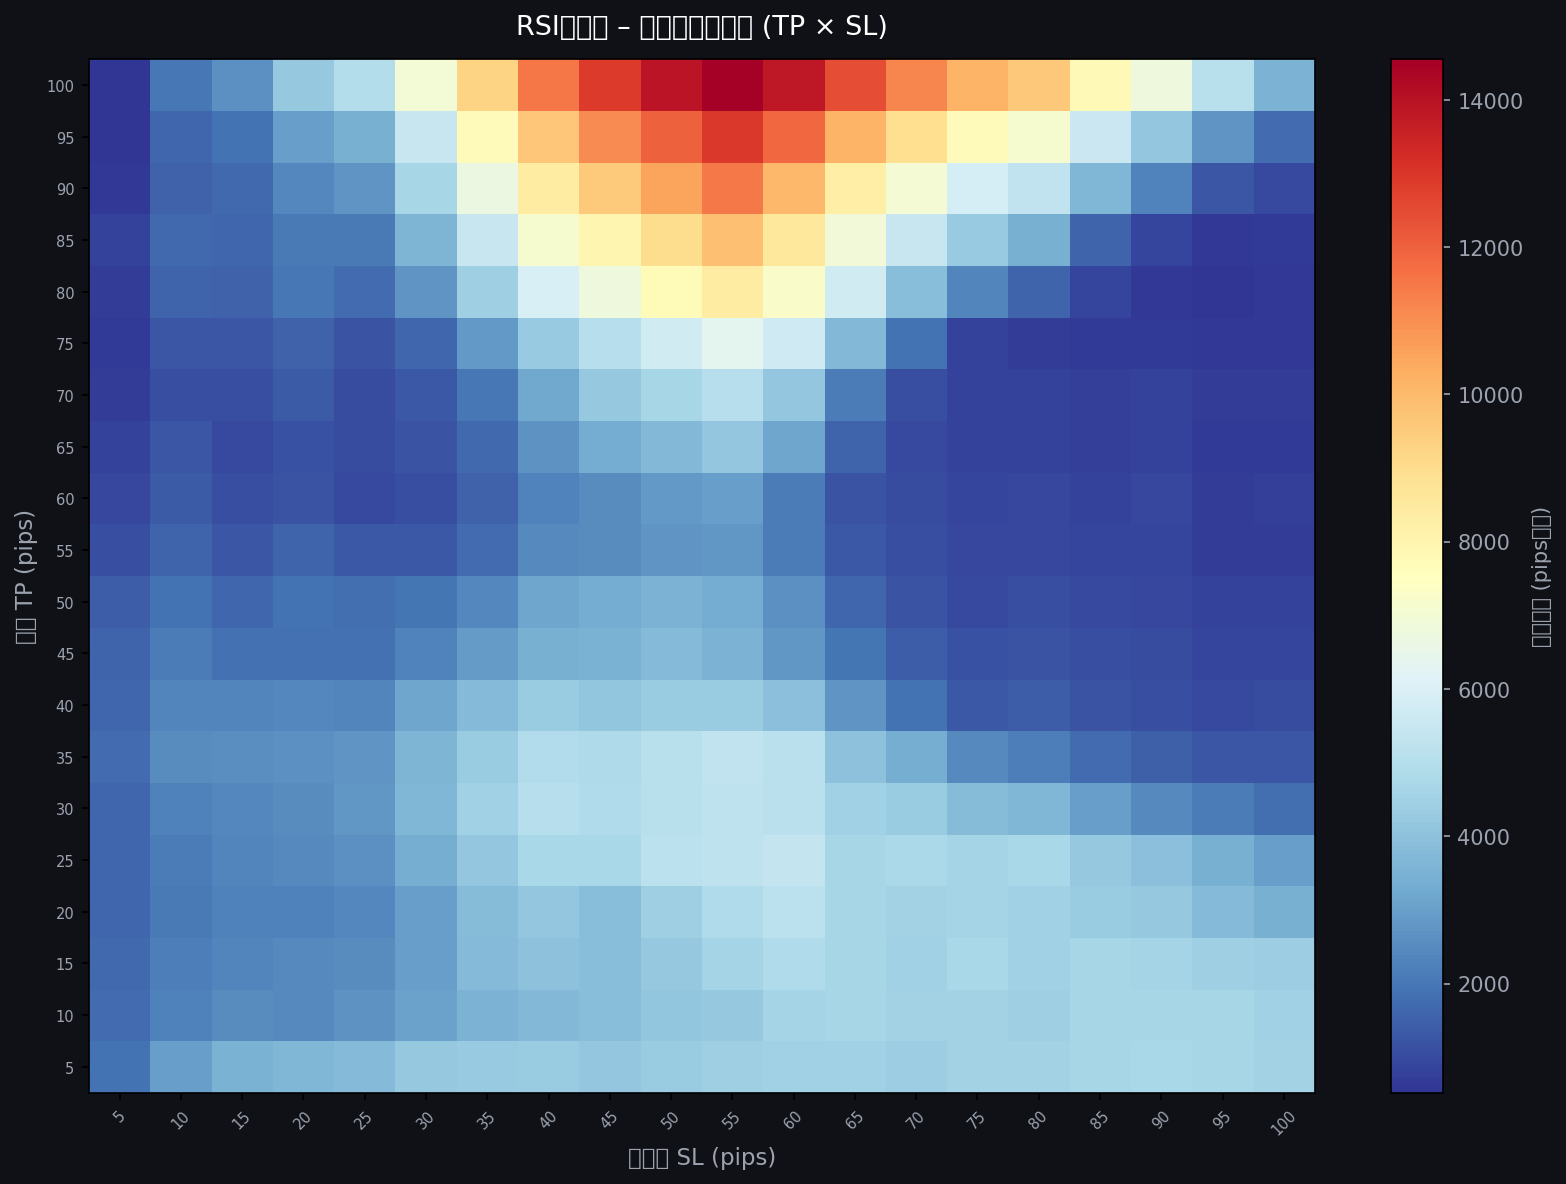
- Yellow/red areas: Extreme drawdown — "Dead Zones"
- Blue areas: Controlled drawdown — "Safe Zones"
Overlay this with the expectancy heatmap: the "green glow" of positive expectancy is also a high-DD zone. Finding a combination that maximizes expectancy while minimizing drawdown is nearly impossible.
I found the faintest hint of a candidate and immediately threw it into the 25-year endurance test.
Top Candidates in the 25-Year Endurance Test
From the 5-year brute force results, we filter elite settings using these criteria:
Trade count filter
df = df[df["trades"] >= 200]
At least 200 trades over 5 years — eliminates lucky curve-fit outliers and ensures statistical relevance.
Score formula
score = expectancy - 0.30 × (SL / trades)
Expectancy is the primary metric; high-DD strategies are penalized.
The top 10 candidates:
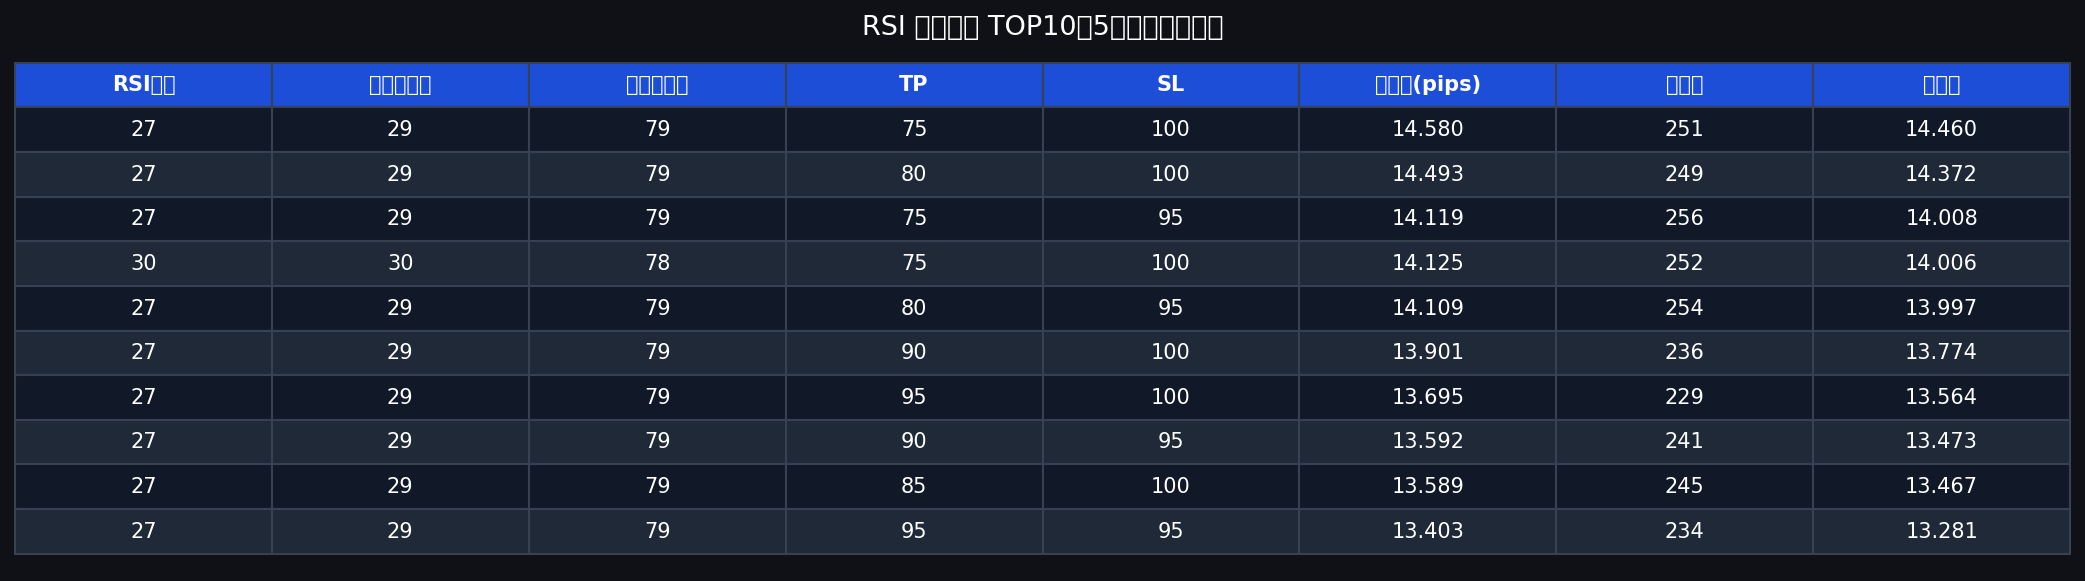
Some of these show expectancy above 14 pips. Promising — or so it seemed.
25-Year Endurance Test Results
The chart speaks for itself.
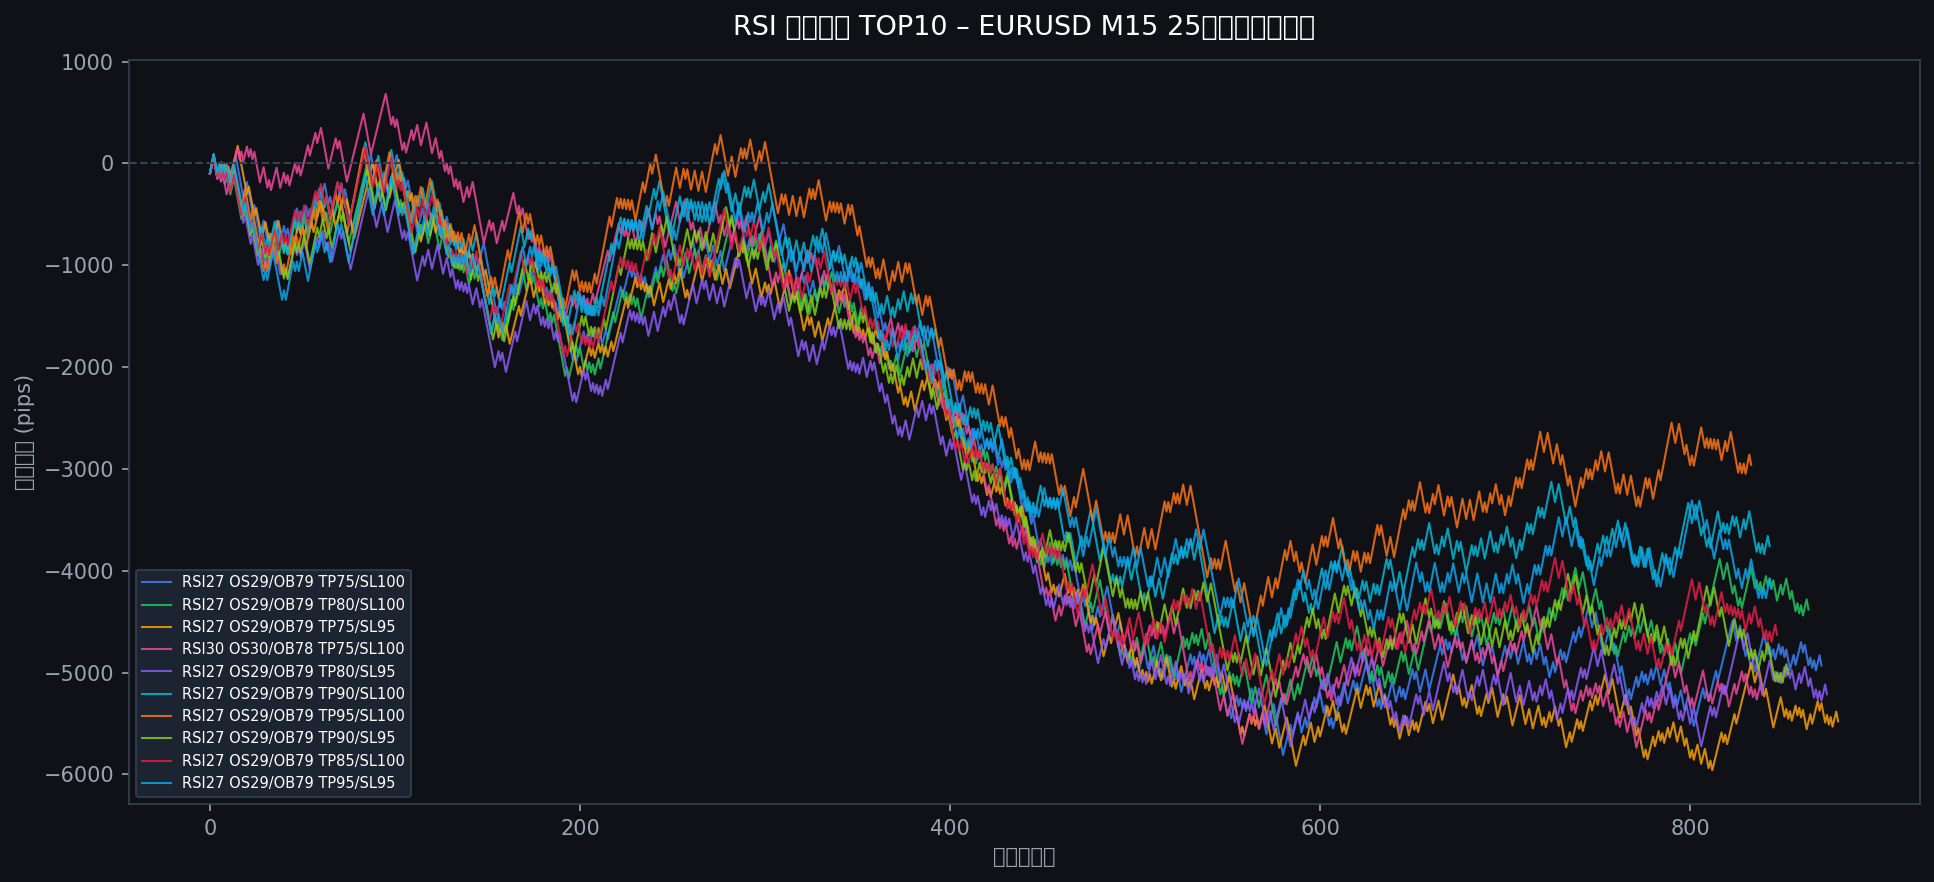
Total wipeout.
The best performer — RSI27 OS29/OB79 TP75/SL100 — still ended at -4,930 pips over 25 years.
Not a single one of the 10 "elite" settings survived.
Why Do the Best Settings Fail?
This chart exposes the fundamental truth of trading and backtesting.
Spread Cost Accumulation
0.7 pips looks negligible. But across 12,000+ trades, the round-trip cost accumulates to thousands of pips.
The top RSI configurations — with their peculiar period values and precise thresholds — generate signals frequently. More entries means more spread cost. Even a positive 5-year expectancy gets overwhelmed.
It Was Just Luck
Five years seems like a lot of data. But seen from a 25-year perspective, it's just one chapter.
The productive framing: "RSI mean reversion had a genuine edge in the 2020–2025 market environment."
That edge may have been real — just not universal.
The Baseline: RSI(14, 30, 70) Over 25 Years
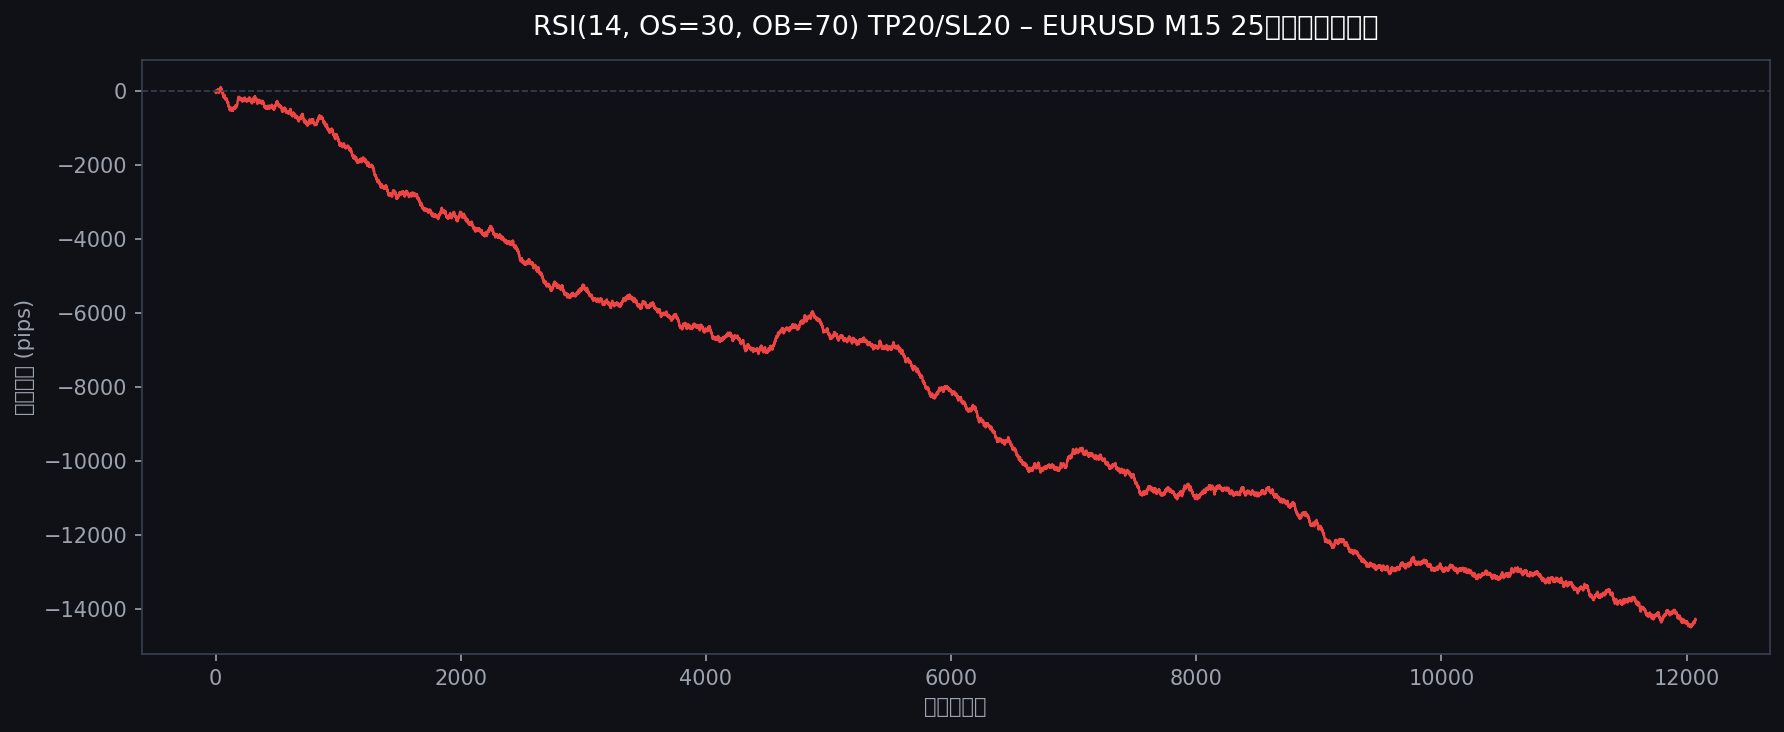
RSI(14, 30, 70) TP20/SL20 over 25 years: -14,287 pips.
12,074 entries. A relentless, consistent downward slope. The myth of "buy oversold, sell overbought" is statistically dead.
Conclusion
Key findings from this study:
-
Of 4,586,400 RSI combinations, 64.3% had negative expectancy over 5 years
-
The textbook RSI(14, 30, 70) lost -14,287 pips over 25 years
-
Top-scoring 5-year settings all failed in the 25-year endurance test
-
Cumulative spread costs are lethal at scale
That said — the important part comes now.
RSI Is Not a Useless Indicator
This study found that 35.7% of configurations were positive over the 5-year window. That's not nothing. RSI clearly captured something real in specific market conditions.
Many traders who feel RSI doesn't work are simply running it on autopilot without context.
Find the Edge — Don't Just Execute the Signal
The core lesson of this article: backtesting exists to find edges, not to confirm fantasies.
We found that RSI mean reversion does have edges — in specific periods, timeframes, and market conditions.
The next step is to extract that edge by filtering with:
- Day of week / time of day
- Trend direction (RSI in a ranging market vs. trending market)
- Price action confirmation
- Longer timeframes
This work is endless — and that's exactly the point.
None of this requires Python. Free backtesting tools exist and can do much of this work. Delver, used in this study, is particularly well-suited for brute-force parameter sweeps.
Open Source Research
In the interest of transparency and reproducibility, the full Python scripts used in this backtest are publicly available on GitHub. Everything from data processing logic to statistical computation is open for review.