"The Trend Is Your Friend" — I came here to test that with 25 years of data.
"Buy the Golden Cross. Sell the Death Cross. That's trading fundamentals."
Every trader hears this. Two moving averages, a crossover, an entry. Clean, simple, elegant.
But I kept asking: does it actually work?
Larry Hite generated over 30% annual returns at Mint Investment Management in the 1990s through trend following — that's real. Winton Group and Man AHL manage trillions in assets through systematic trend following — also real.
But none of them are simply "waiting for a crossover on a 15-minute chart."
I started with EURUSD M15: 7,830 EMA pair combinations, then expanded to eliminate the question "was EURUSD just special?" — running 9 currency pairs × 4 timeframes × 23,655 EMA pairs × 1,600 TP/SL combinations: 1,362,528,000 total simulations.
What I found is categorically different from what the Bollinger Band and RSI studies revealed — and that difference tells you something fundamental about what moving averages actually are.
The Scope of This Study
We test the most fundamental trend-following strategy: when the short EMA crosses above the long EMA (Golden Cross) → Long. When it crosses below (Death Cross) → Short.
No filters. No additional conditions. Pure mechanical execution across all conceivable parameter combinations.
"Trend following works only if price has momentum. Technical indicators are merely detectors of that momentum." — David Harding (Winton Group founder)
"Follow the system. Cut losses without hesitation. Ride the trend. That's all there is." — Ed Seykota (trend following pioneer, Market Wizards)
This study uses the exact same data source and conditions as our Bollinger Bands 25-year brute force backtest.
First: Testing the Common Settings (EURUSD M15)
Let's start with the "textbook" configuration, verified through Delver.
Test Conditions

- Instrument / Timeframe: EURUSD M15
- Spread: 0.7 pips
- Slippage and swap: Disabled
- Leverage: 25x
- Risk management: Fixed lot
EMA Settings
Short EMA 25, Long EMA 75 — the most commonly cited "standard" configuration.
- Long (Golden Cross): EMA25 crosses above EMA75
- Short (Death Cross): EMA25 crosses below EMA75
- Exit: TP20 pips / SL20 pips (RR 1:1)
5-Year Results (2020–2025)
- Expectancy: -1.563 pips/trade — losing over 1.5 pips on every single trade.
- Trade count: 1,669 — that many crosses over 5 years on M15.
Not as catastrophic as Bollinger Bands, but clearly a losing strategy.
The obvious hypothesis: maybe the TP/SL settings were wrong. Let's test everything.
The Exit Condition Hypothesis
Maybe EMA25/75 is fine but TP20/SL20 was wrong?
This is a trend-following strategy — shouldn't we let profits run much further to catch the big moves?
Or should we cut losses harder?
Let's answer all of this at once.
Brute Force Testing with Python (Phase 1: EURUSD M15)
With 3 million+ combinations, Python is the only practical option.
Full Test Scope
- Entry logic: EMA short crosses above EMA long → Long; below → Short
- Short EMA: 5–50 (step 1, 46 values)
- Long EMA: 20–200 (step 1, 181 values)
- Constraint: short < long only (7,830 valid pairs)
- TP: 5–100 pips (step 5, 20 values)
- SL: 5–100 pips (step 5, 20 values)
- Period: 5 years (EURUSD M15, 2020–2025)
- Total combinations: 3,132,000
Results (EURUSD M15)
This is where MA cross diverges sharply from Bollinger Bands and RSI.
Expectancy Distribution
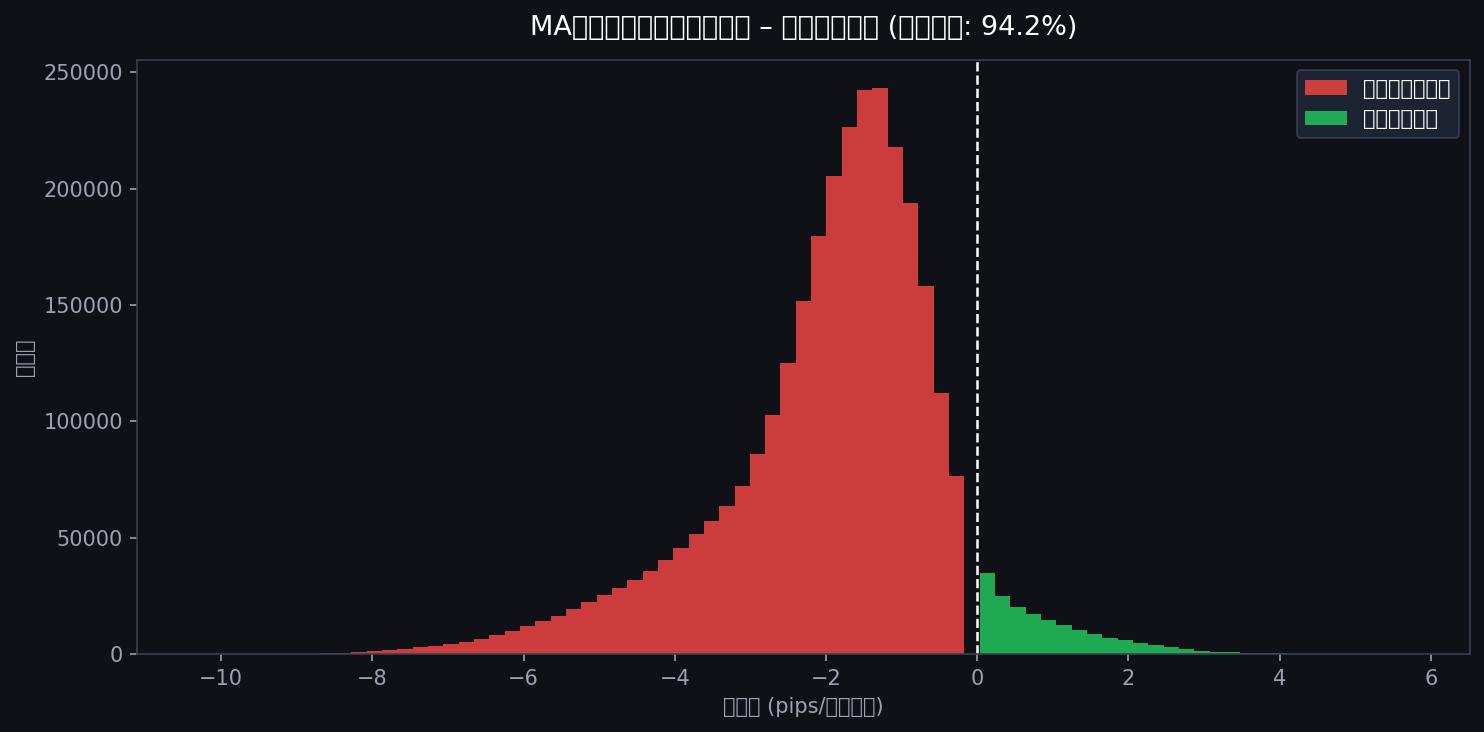
Of 3,132,000 cases, 94.2% had negative expectancy. Only 5.8% were positive.
This is significantly worse than RSI (64.3% negative) or Bollinger Bands. The overwhelming majority of EMA cross configurations simply don't work.
So why do traders keep using Golden Crosses?
Confirmation bias and survivorship bias. The crossovers that worked are remembered; the dozens that triggered false entries are forgotten.
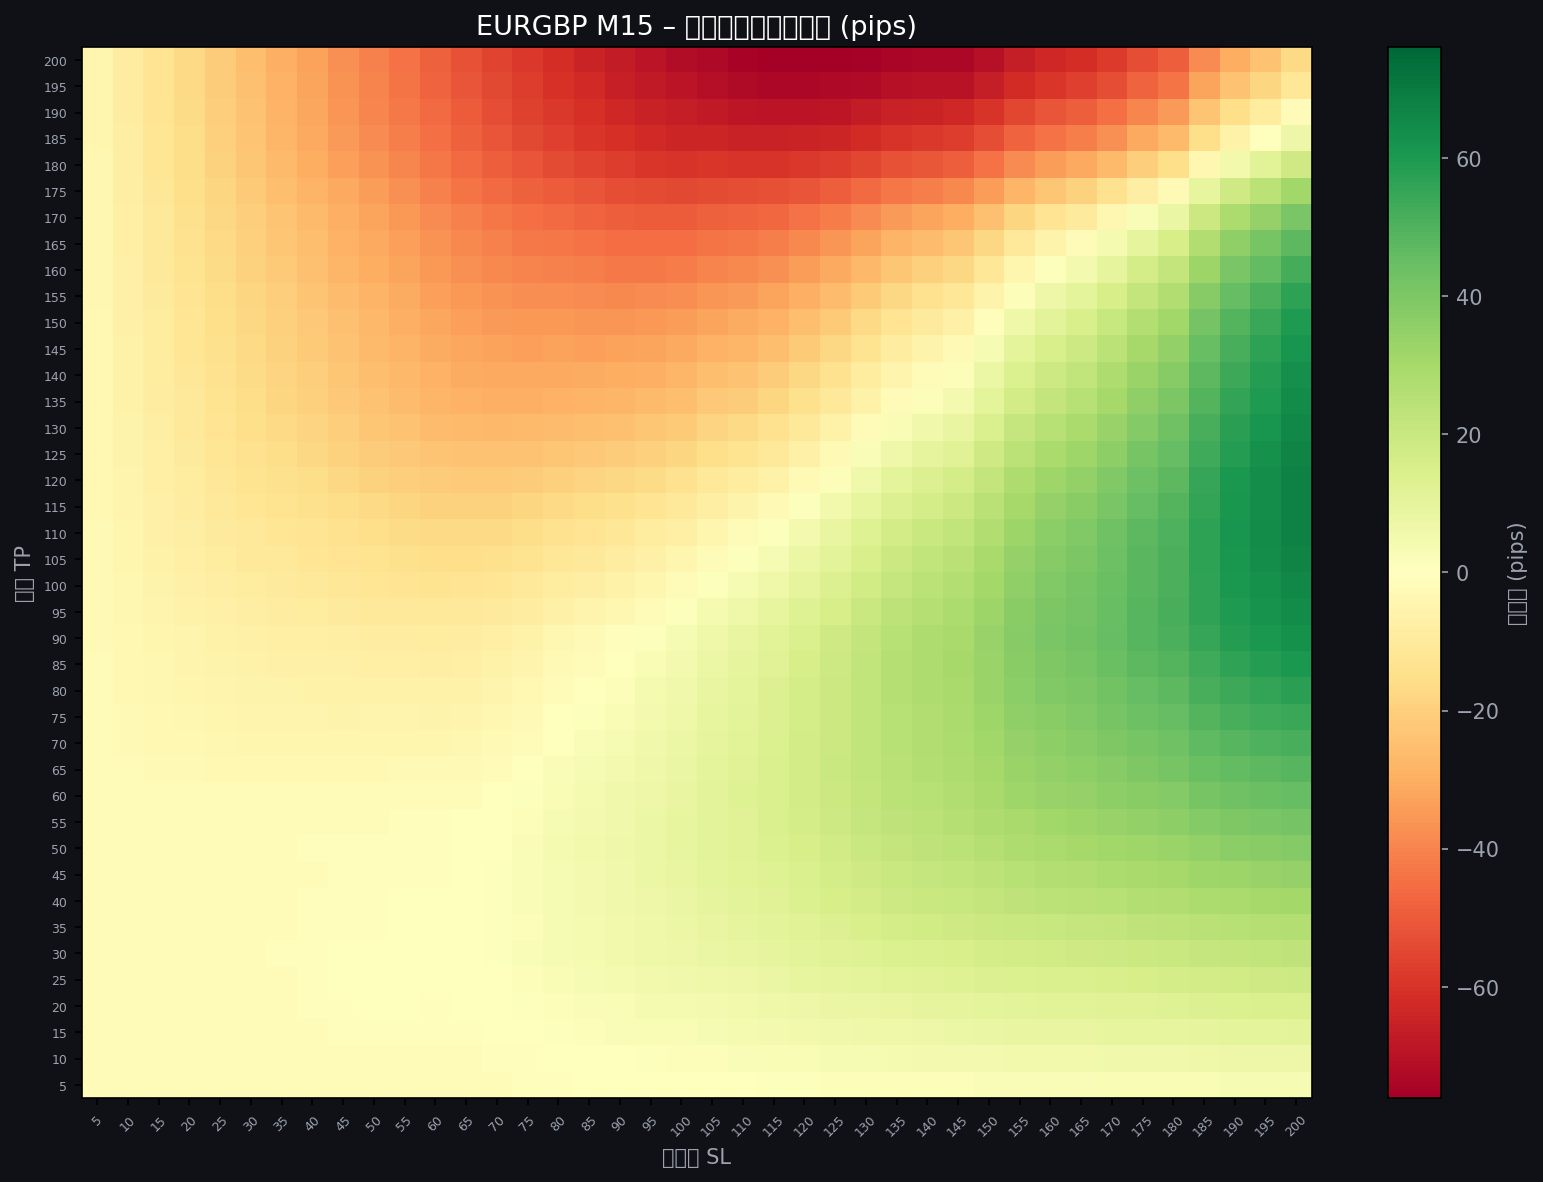
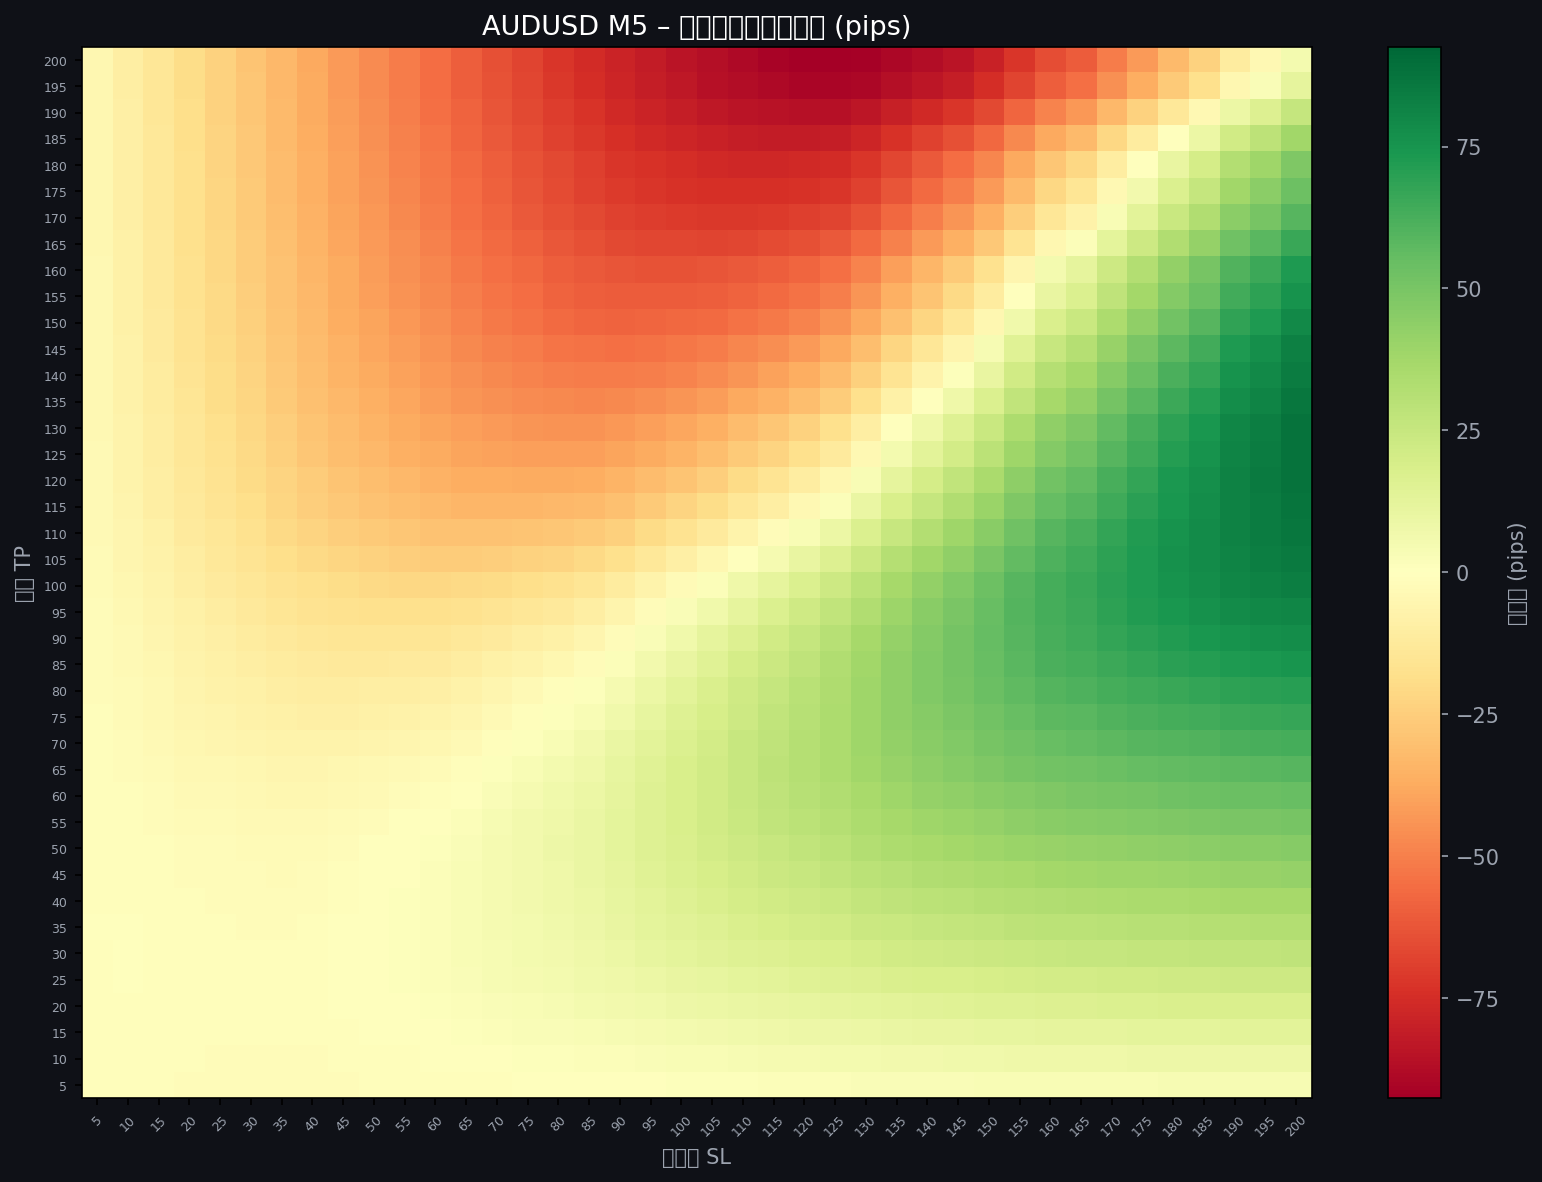
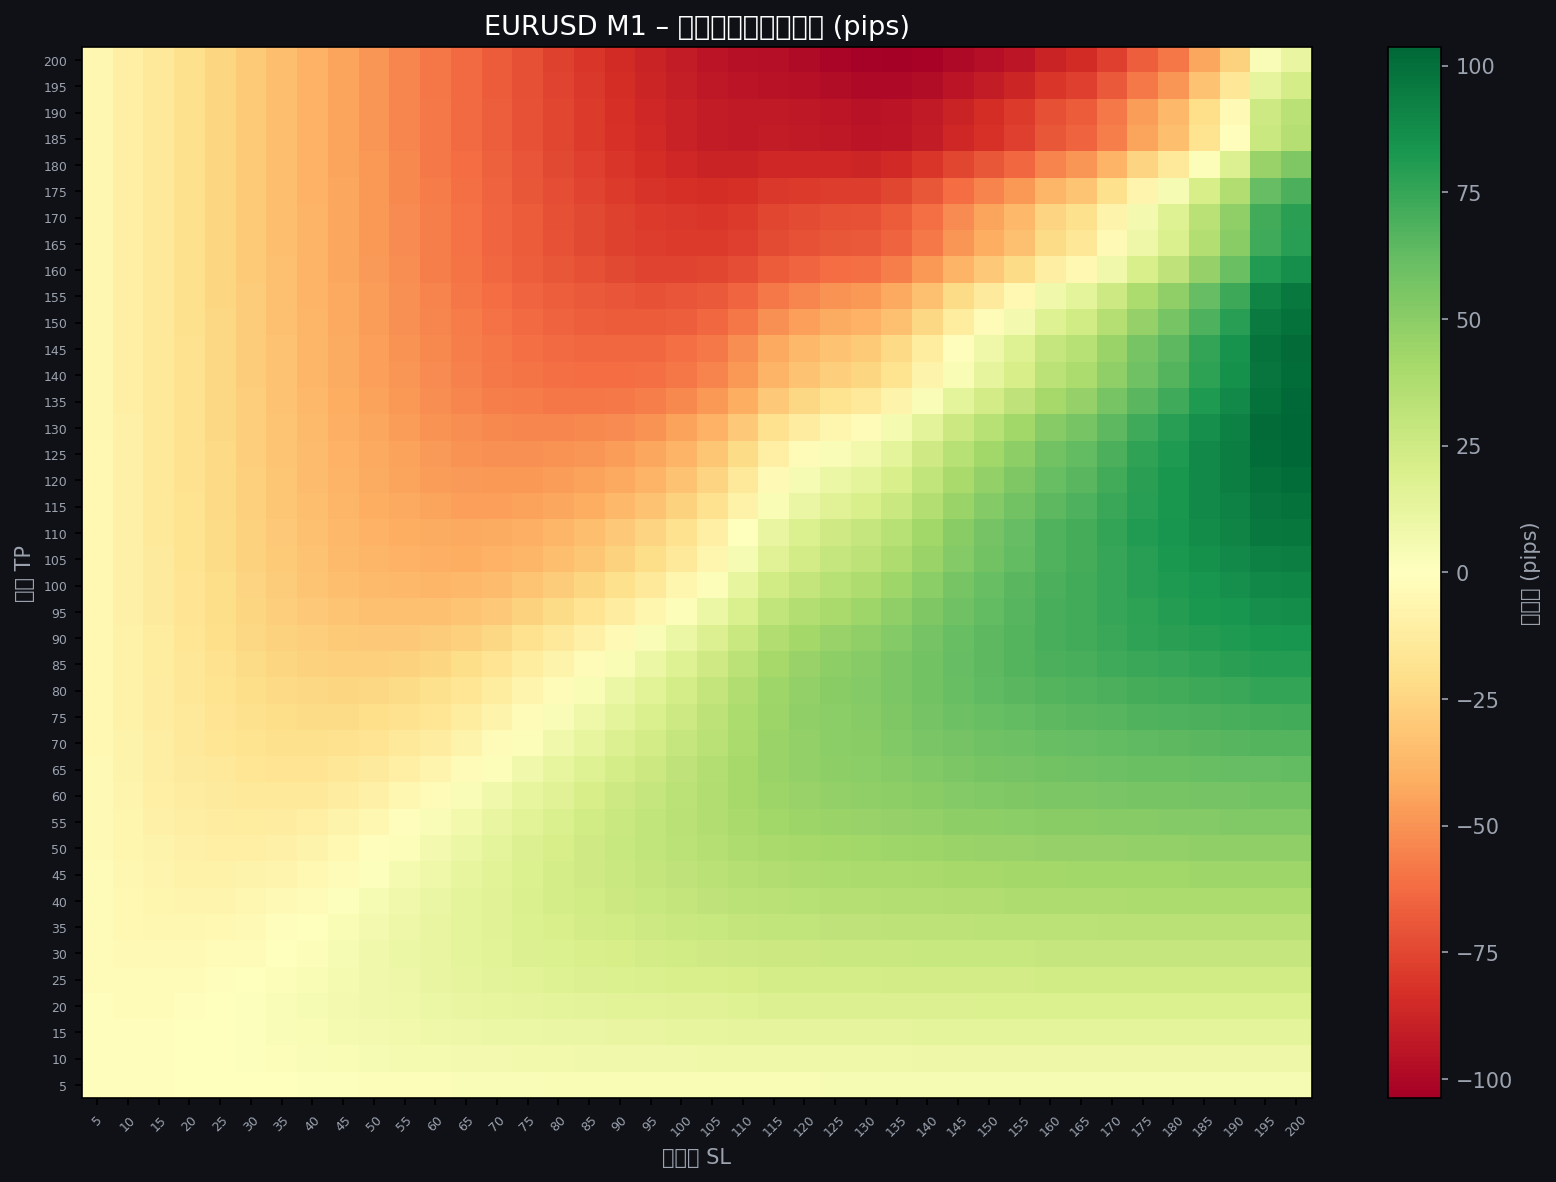
TP × SL Expectancy Heatmap
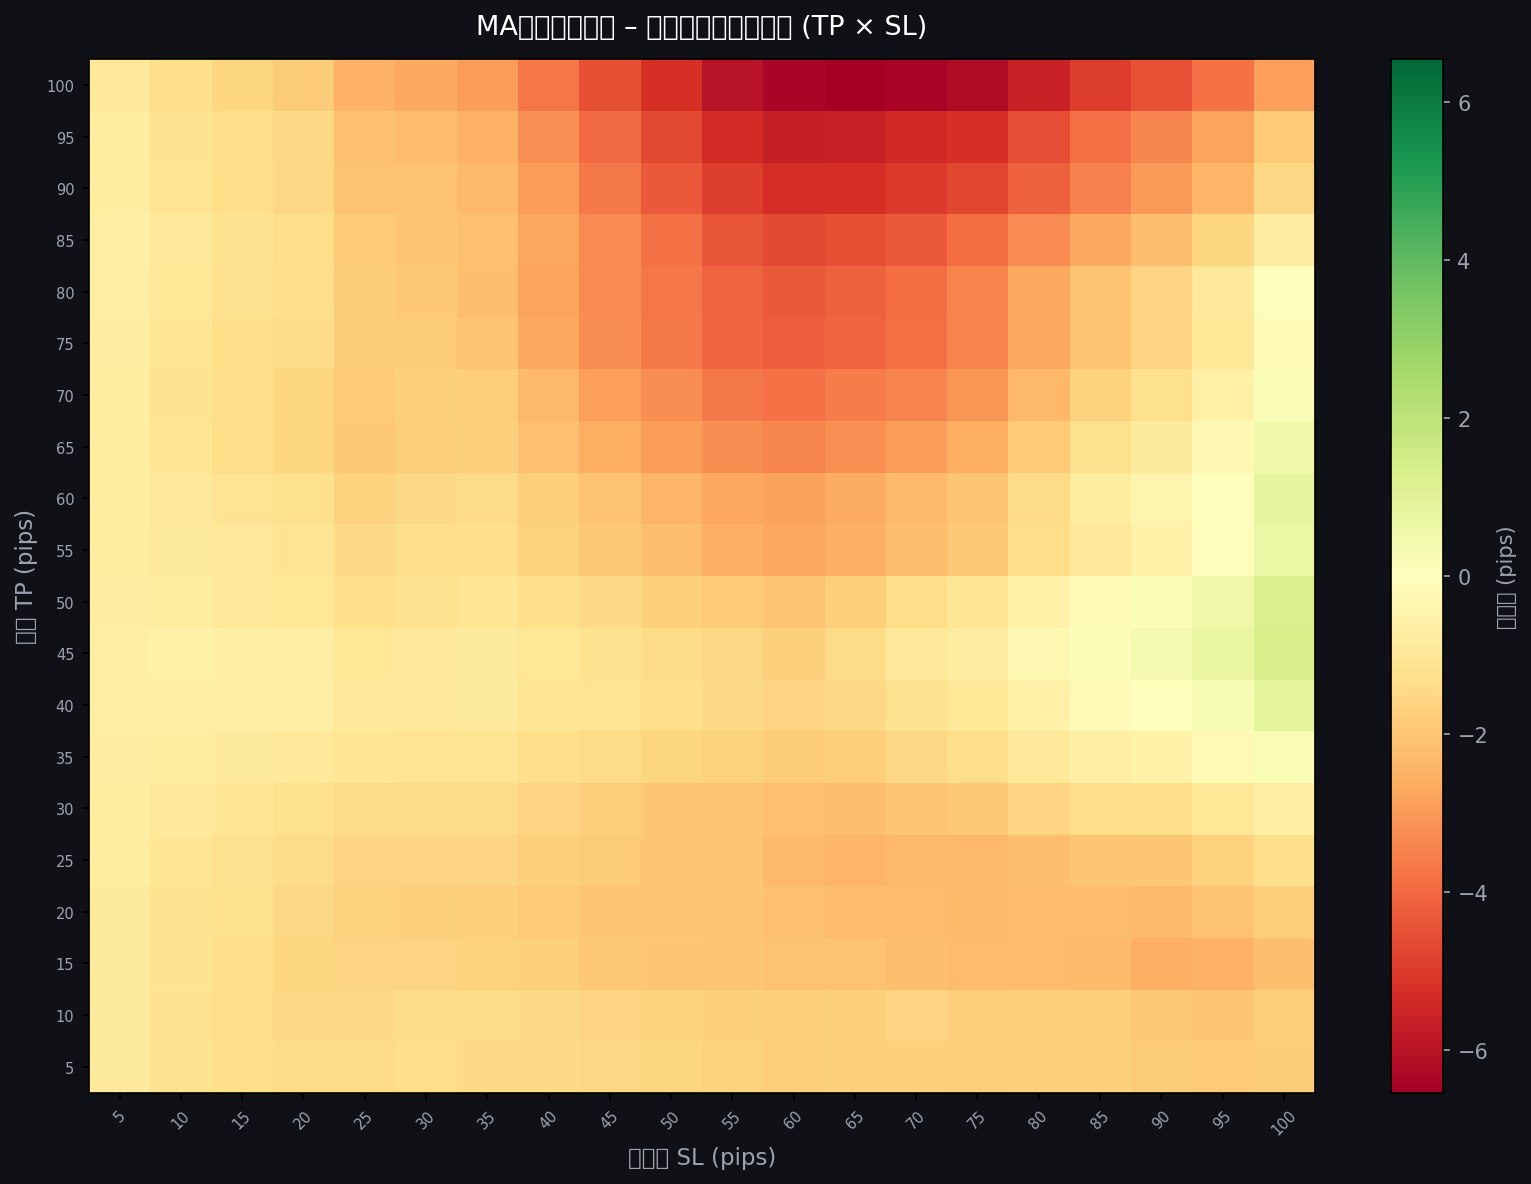
This heatmap looks fundamentally different from the Bollinger Band and RSI versions.
Where BB and RSI showed a uniformly dark "map of death," this heatmap has a clear green band on the right side (large SL) with mid-to-large TP values.
What does this mean?
After a Golden Cross signal, a genuine trend sometimes develops that runs far. To capture it, you need a large SL to survive the false starts, and a meaningful TP to lock in gains when the real move arrives.
Small SL settings get demolished by whipsaws — the notorious "fake-outs" that occur right after crossovers in ranging markets.
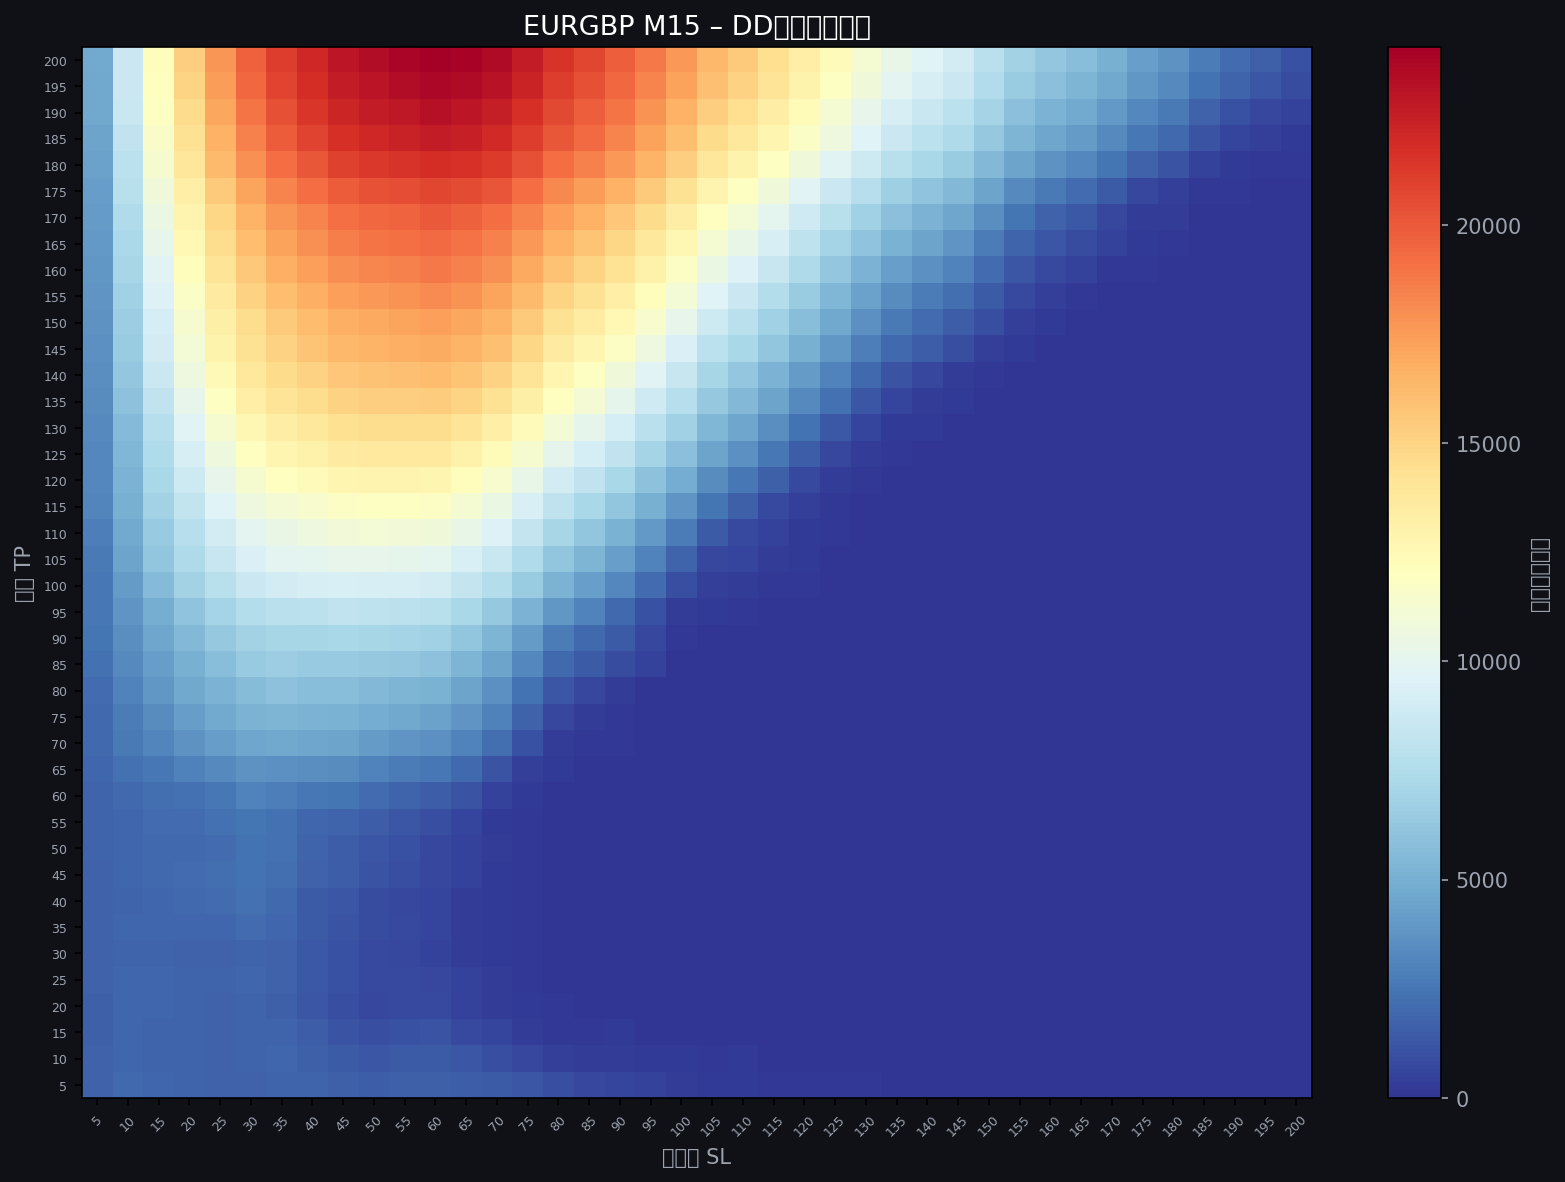
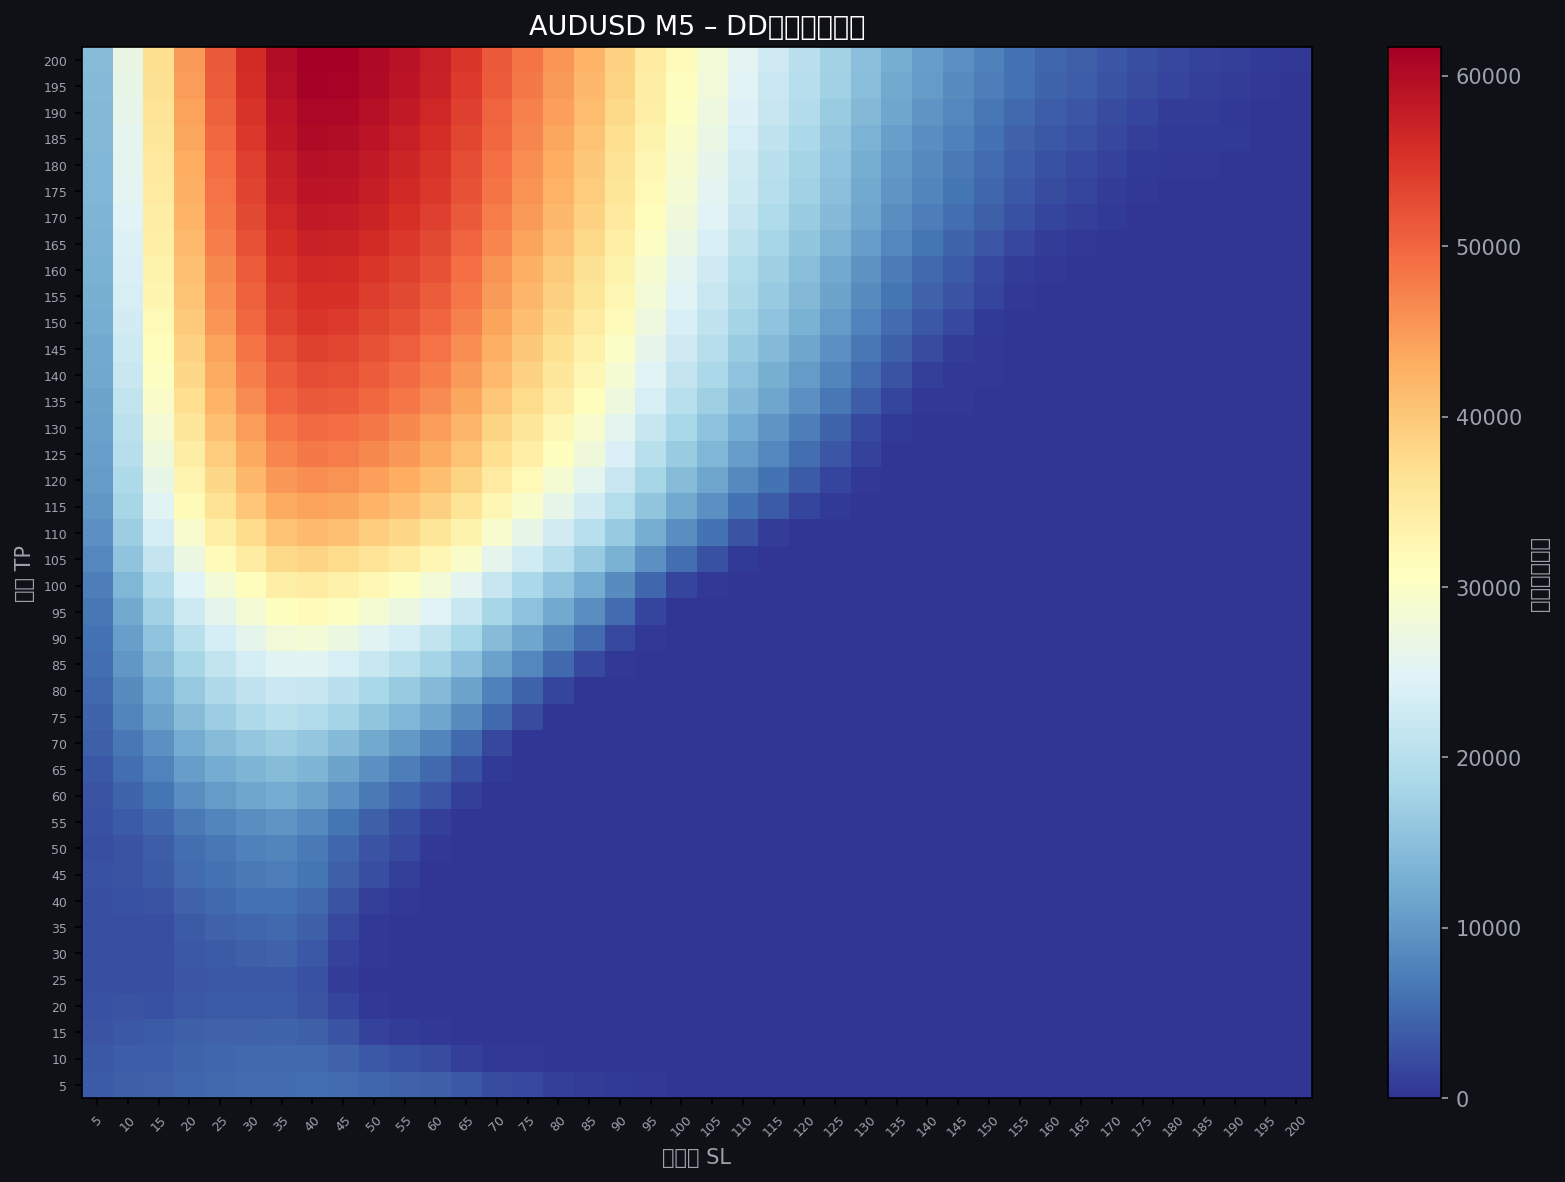
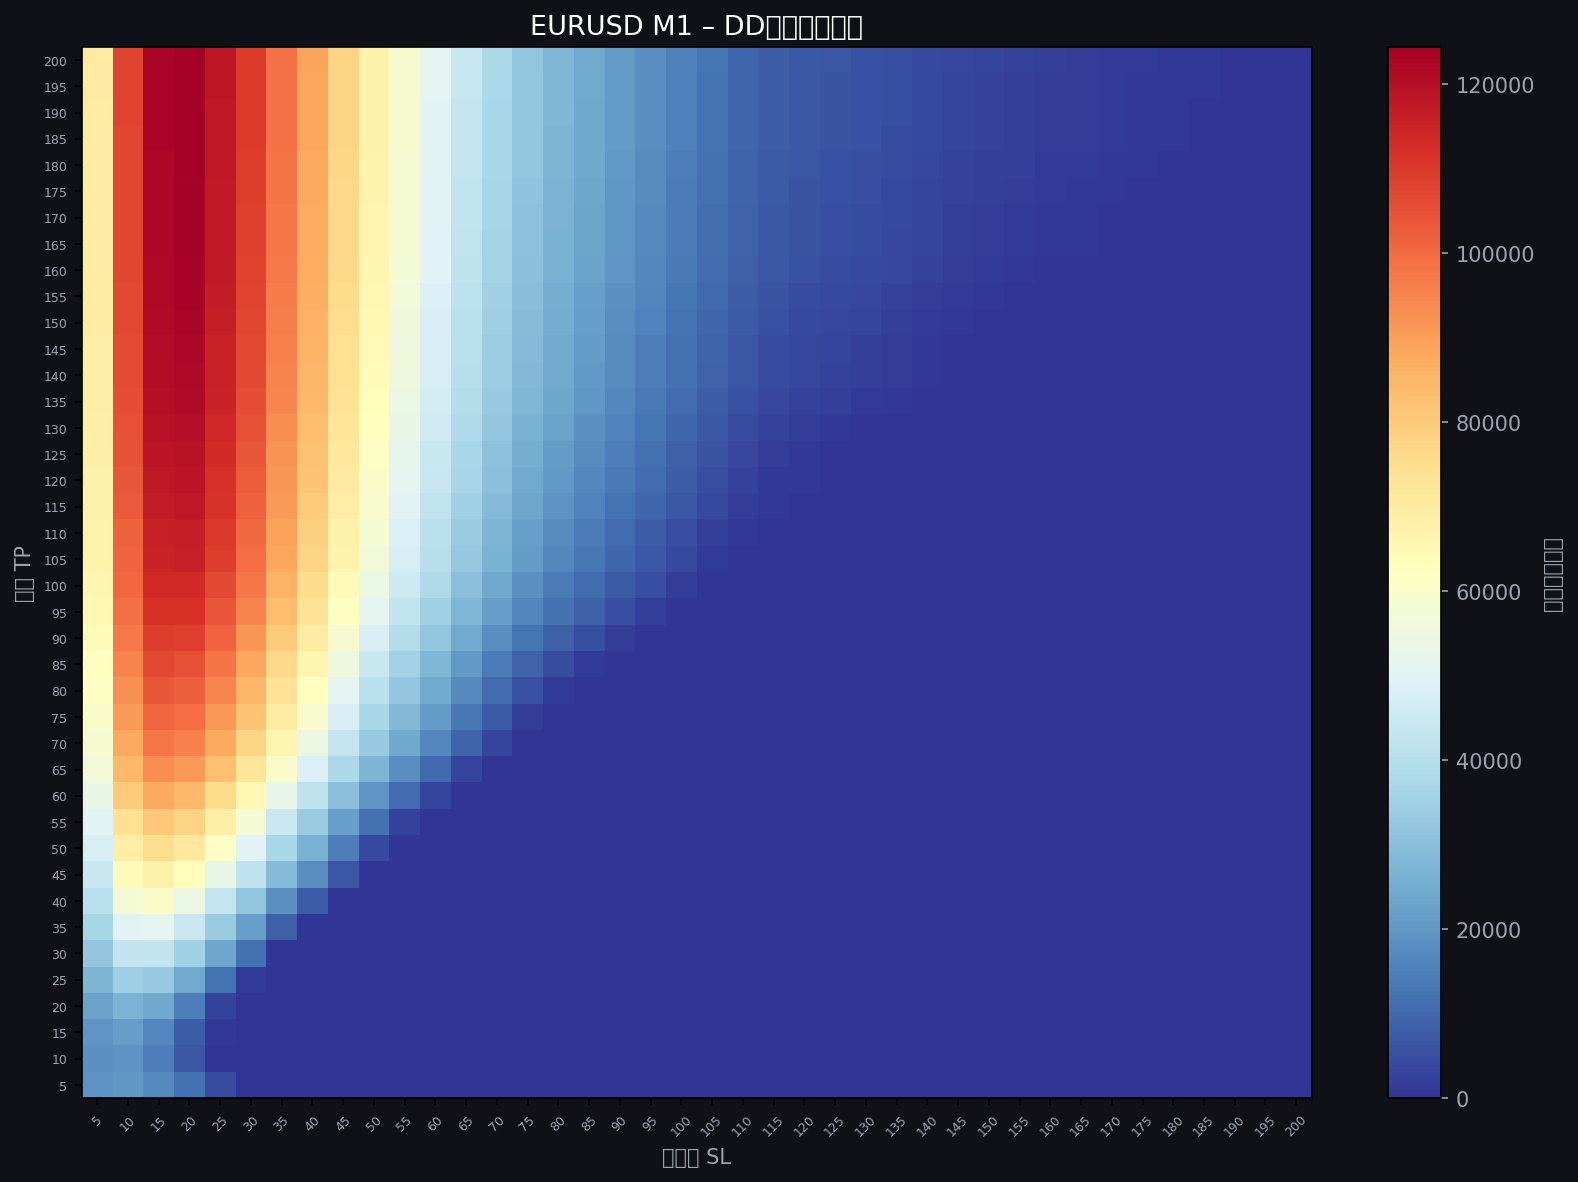
Drawdown Heatmap
Drawdown is the critical reality check. The holy grail myth collapses on contact with sustained drawdown.
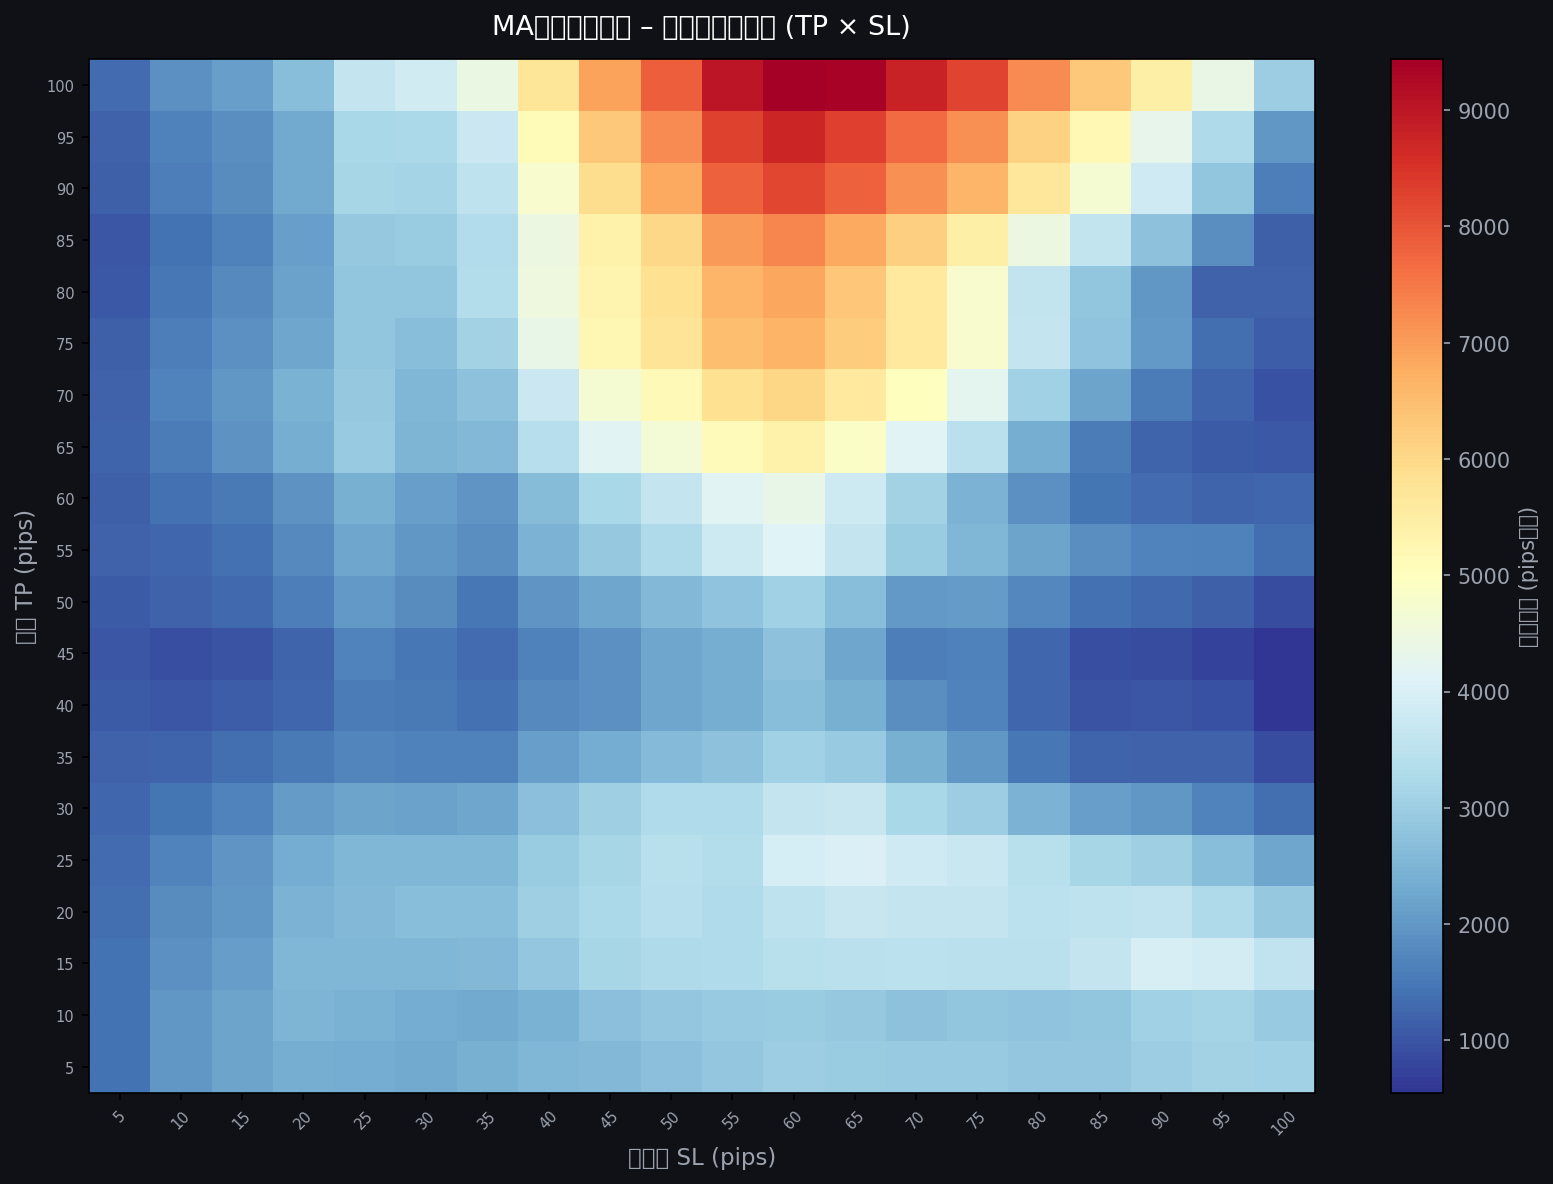
Unlike BB and RSI, where the "green zone" of positive expectancy overlapped with extreme DD, here the overlap is more reasonable.
A narrow zone exists where expectancy is positive and DD is manageable simultaneously — something neither BB nor RSI could demonstrate.
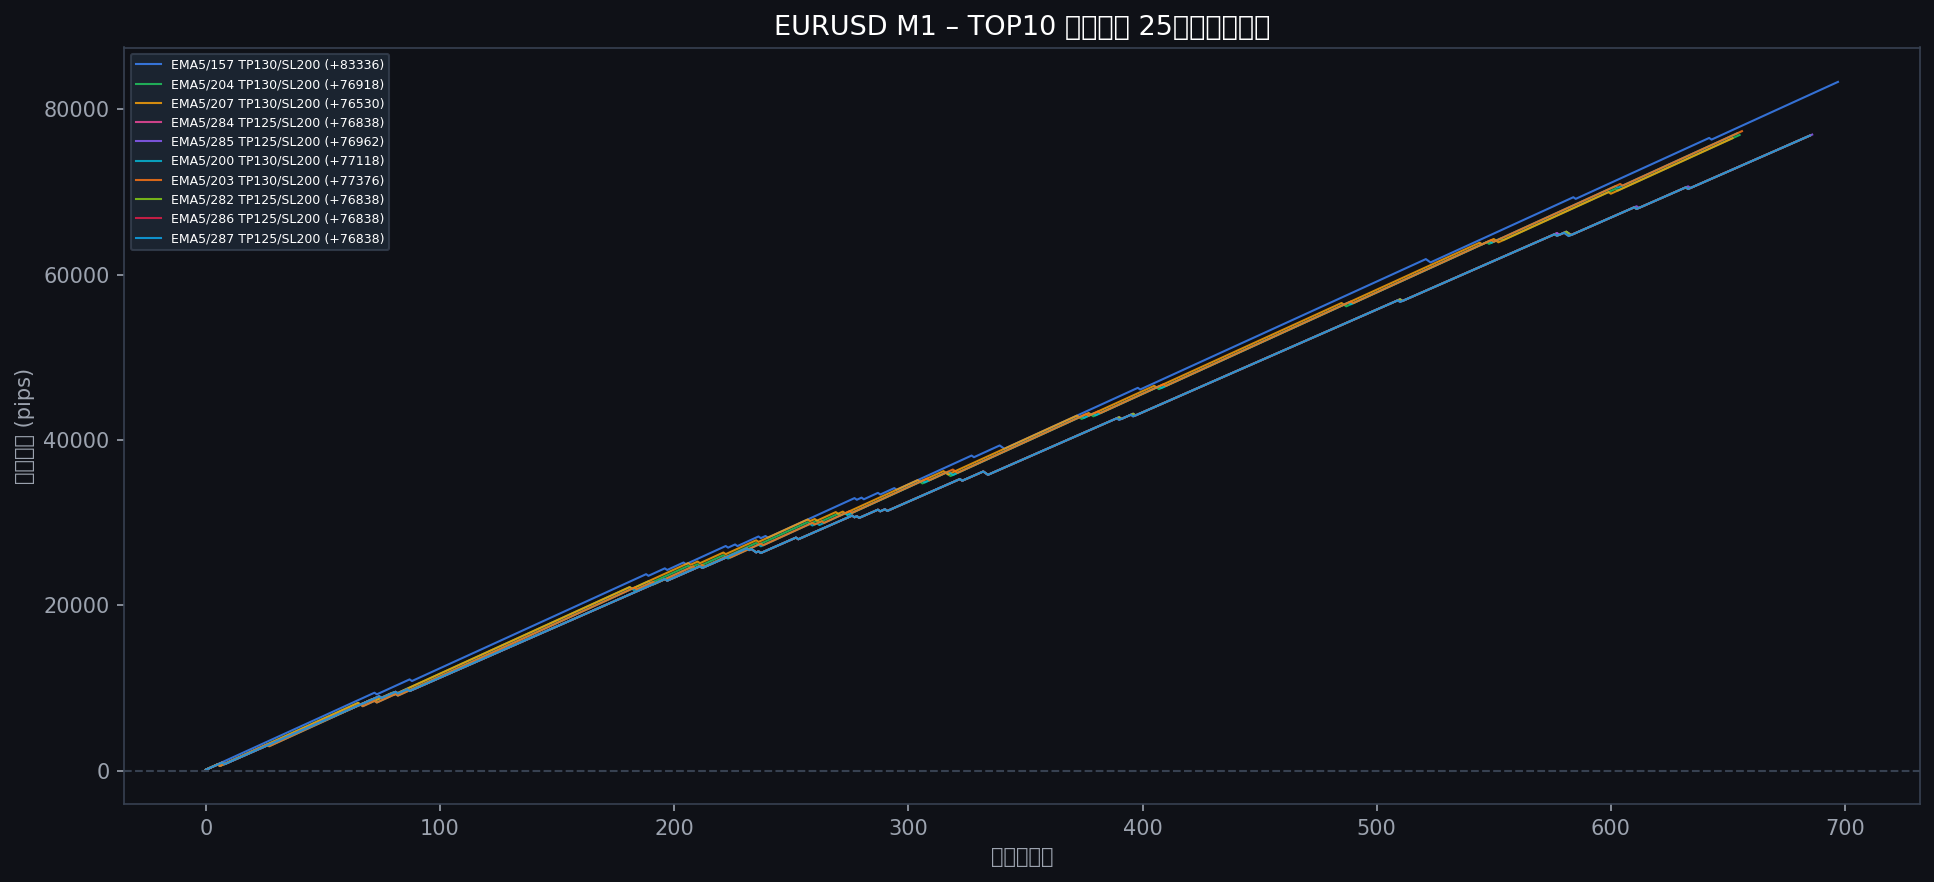
Top Candidates in the 25-Year Endurance Test
Trade count filter
df = df[df["trades"] >= 200]
Score formula
score = expectancy - 0.30 × (SL / trades)
Top 10 candidates:
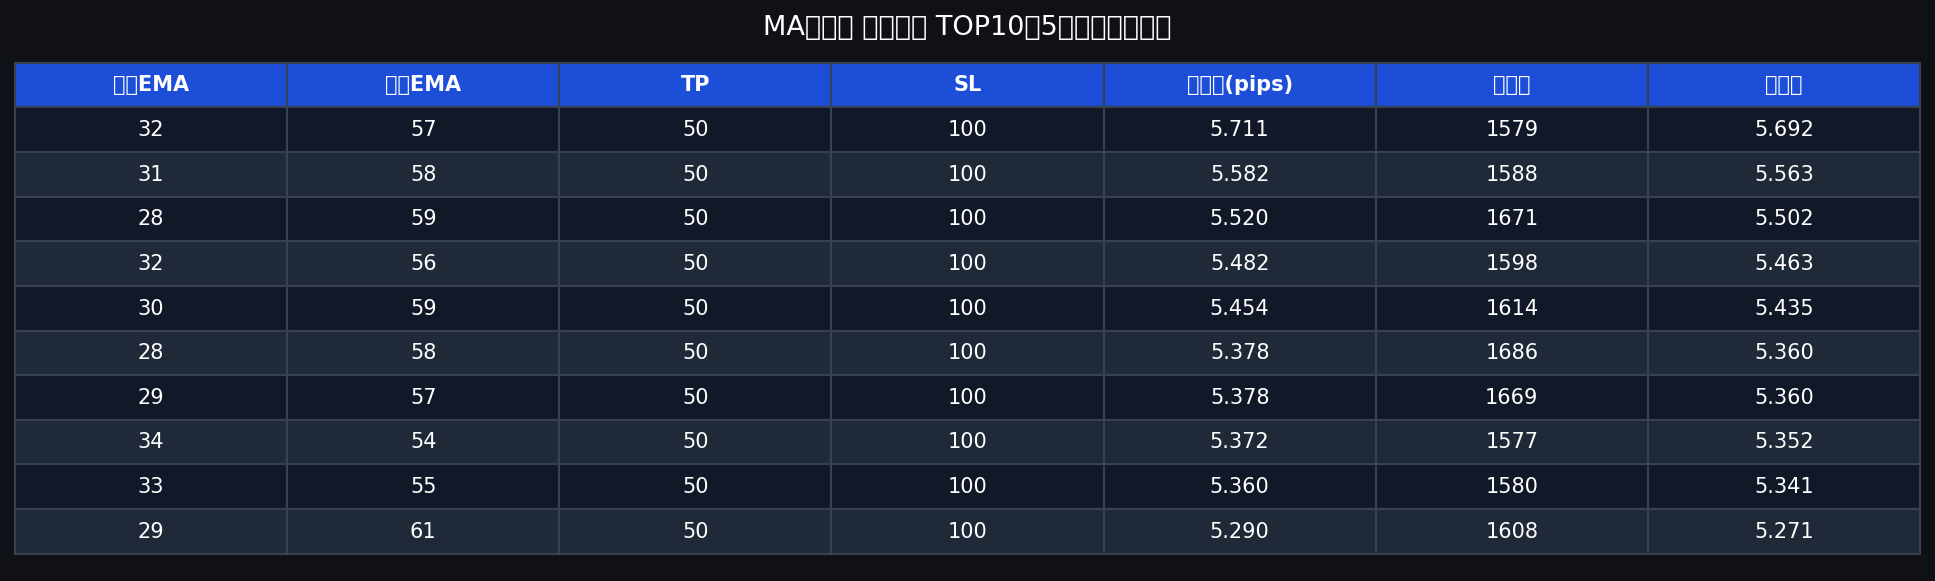
All top settings cluster around short EMA 28–34, long EMA 54–61. This is a medium-frequency crossover — not so fast that it's noisy, not so slow that it misses trends. All have SL = 100 pips: maximum whipsaw tolerance. This narrow clustering is a sign the result is statistically meaningful rather than curve-fitted noise.
25-Year Endurance Test Results
Here's where the story fundamentally changes from our previous studies.
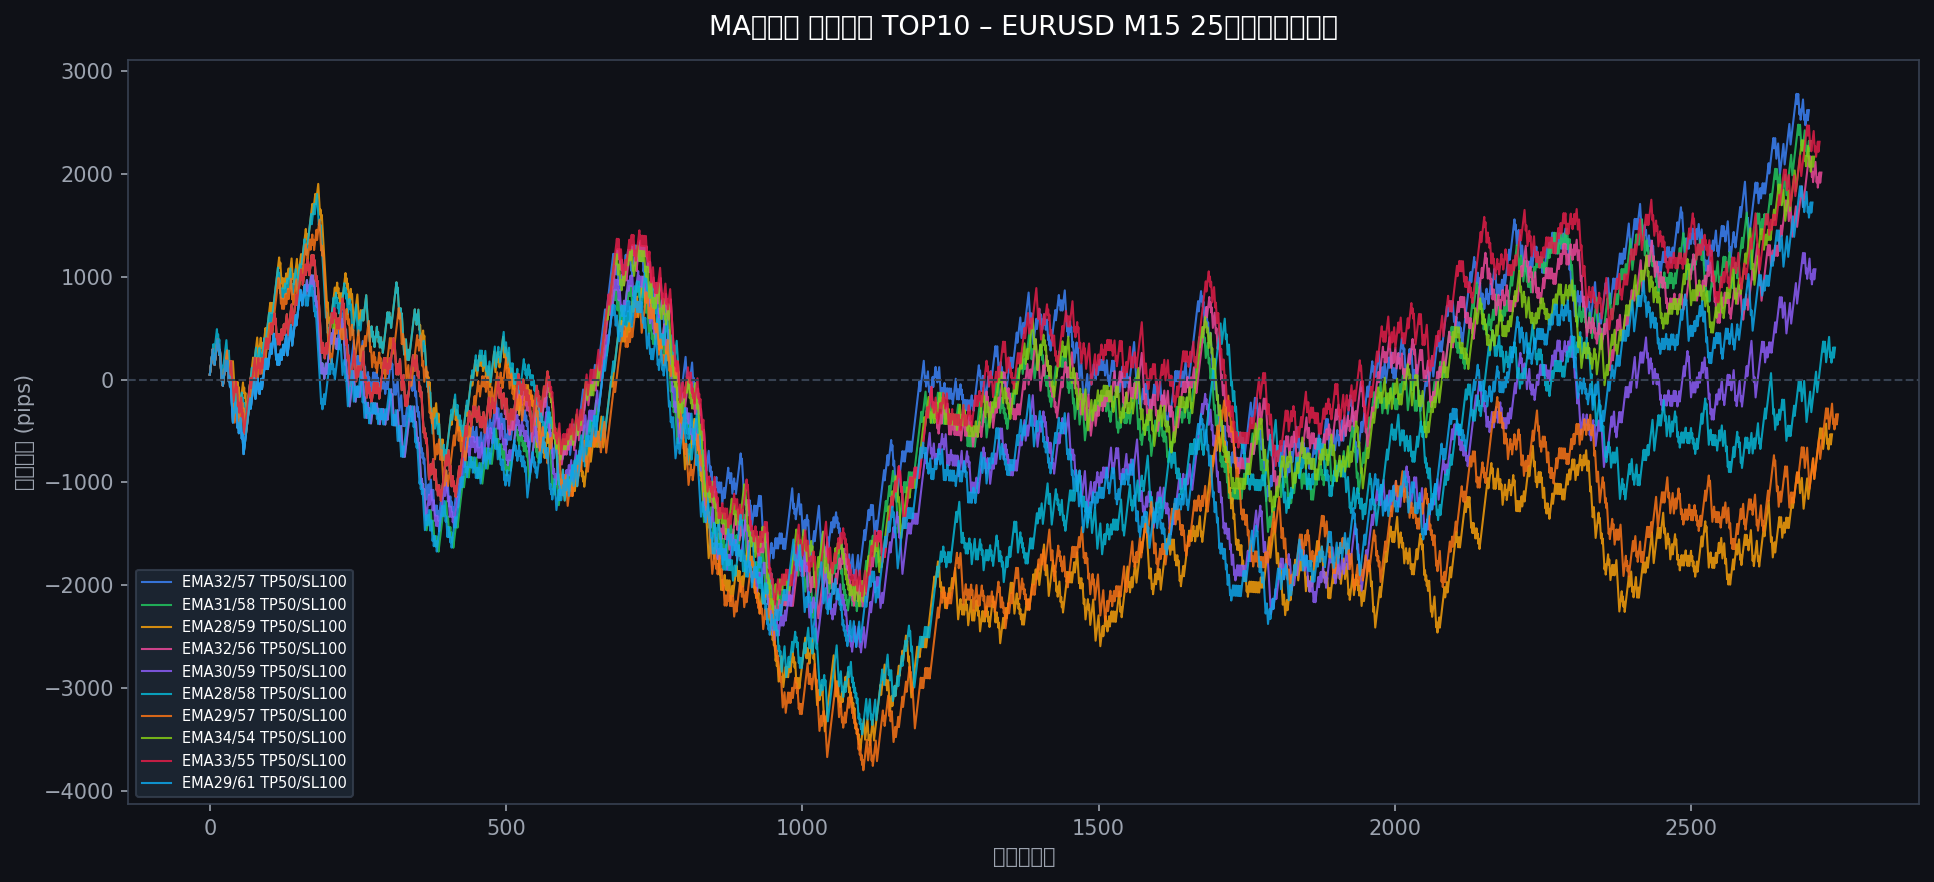
8 out of 10 conditions survived 25 years in positive territory.
- EMA32/57 TP50/SL100 → +2,622 pips
- EMA31/58 TP50/SL100 → +2,322 pips
- EMA33/55 TP50/SL100 → +2,315 pips
- EMA34/54 TP50/SL100 → +2,170 pips
- EMA32/56 TP50/SL100 → +2,015 pips
- EMA29/61 TP50/SL100 → +1,723 pips
- EMA30/59 TP50/SL100 → +1,074 pips
- EMA28/58 TP50/SL100 → +312 pips
Bollinger Bands: 0/10 survived. RSI: 0/10 survived. MA cross: 8/10 survived.
This is a categorical difference — but we need to interpret it carefully before drawing conclusions.
Why Did These Settings Survive?
The meaning of SL100
Every surviving condition uses SL = 100 pips. This is not a coincidence.
On EURUSD M15, a genuine trend that follows a Golden Cross often faces significant counter-moves before resolving directionally. SL100 means the strategy absorbs those counter-moves without being stopped out.
The psychological question: can you hold through a 100-pip adverse move waiting for the trend to develop?
Concentration in specific periods
Looking at the equity curves, growth is not linear. The positive P&L accumulates in specific trend-heavy periods, while ranging markets produce flat or mildly negative segments.
This reveals the dual nature of MA cross:
- In ranging markets: continuous small losses from whipsaws
- In trending markets: large gains that more than compensate
This is exactly what Winton and Man AHL have built billion-dollar businesses on — at a much more sophisticated level.
The Baseline: EMA(25,75) Over 25 Years
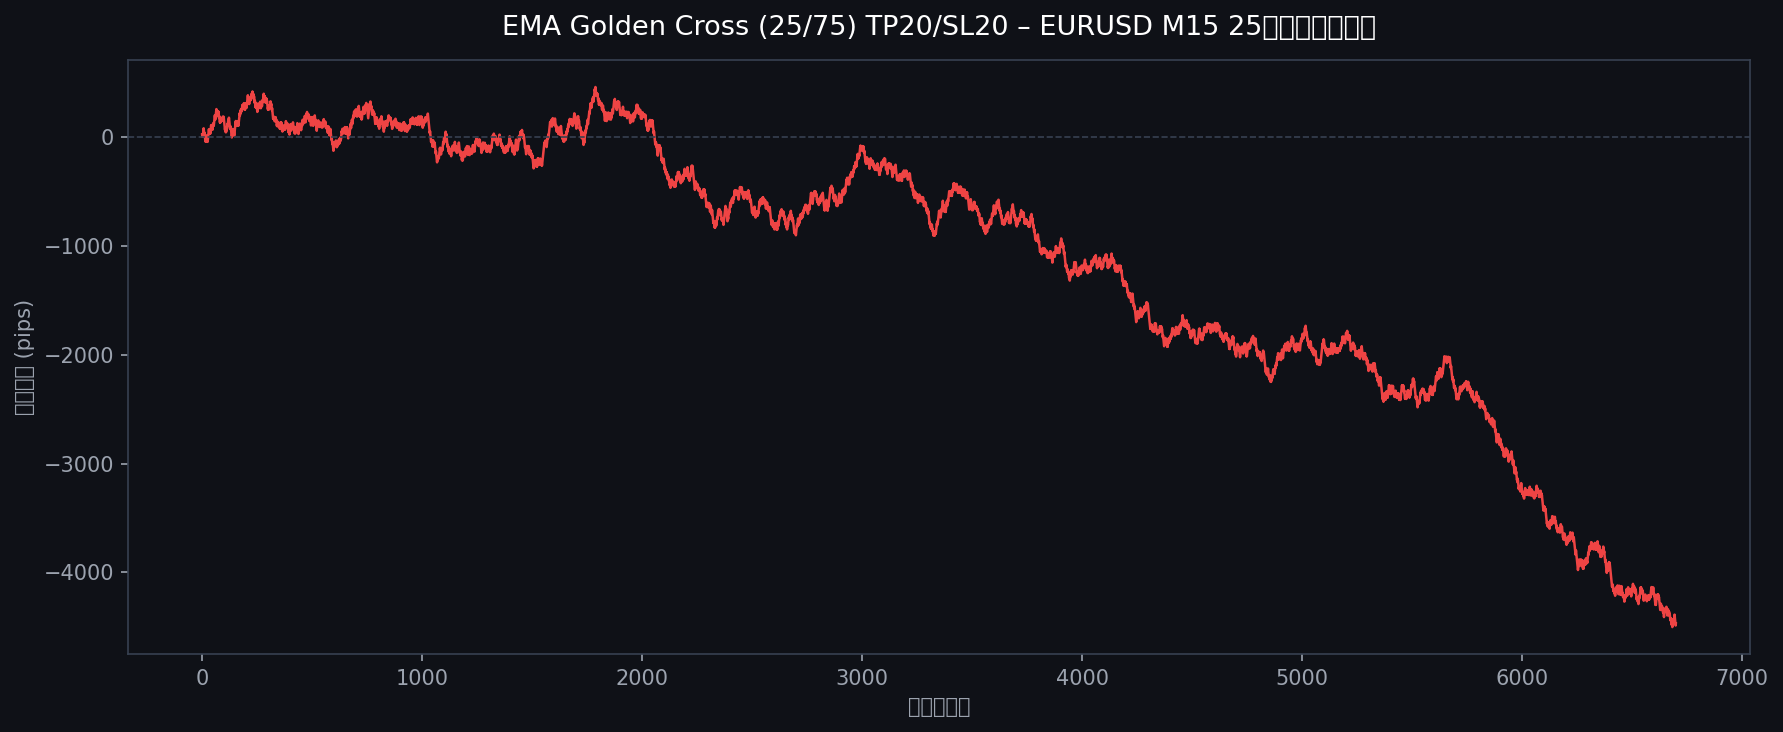
EMA(25,75) TP20/SL20 over 25 years: -4,467 pips.
6,700 entries. A consistent loser. "Standard" Golden Cross settings with mechanical execution don't work.
Why One Currency Pair Isn't Enough
The results above are one data point: EURUSD M15.
An engineer must ask: Was EURUSD special? Is M15 somehow unique?
The limitations of a single-pair study are clear.
-
10 coin flips producing 6 heads doesn't prove the coin is biased. Twenty-five years looks long, but market regimes (trending vs. ranging environments, volatility cycles) shift continuously. One pair is one scenario.
-
EURUSD is the world's most liquid currency pair. Tightest spreads. Highest algorithmic concentration. These characteristics might specifically favor EMA crossover performance in ways that don't generalize.
-
Timeframe changes the "grain" of momentum. The intermediate trend captured by M15 crossovers is fundamentally different from the long-wave trends captured at H1.
"Does what worked on EURUSD also work on USDJPY?"
"Does what worked on M15 break on M5?"
The only way to answer these questions is comprehensive multi-dimensional testing.
Phase 2: Large-Scale Parallel Backtest — 9 Pairs × 4 Timeframes
Implementation Choice: Python vs. Rust
With 1.36 billion simulations, the choice of implementation language was the first engineering decision.
Why we considered Rust: Compiled, low-level code with 10–50× Python performance. Maximum memory efficiency.
Why we chose Python: The Rust toolchain (cargo) was not installed in this environment, and the dependency build cost was high. Python's NumPy provides C-level numerical computing, and combining a "best-score-only" approach (storing only the best (TP,SL) per EMA config instead of all 1,600 combinations) with 28-worker multiprocessing on 32 cores made the math work: 1.36 billion evaluations in 27.6 minutes.
Rust's advantage matters most for real-time, fine-grained processing. For batch backtesting, NumPy + parallelization is competitive.
Full Study Parameters
-
Currency pairs (9): EURUSD, USDJPY, AUDUSD, EURGBP, EURJPY, GBPJPY, NZDUSD, USDCAD, XAUUSD
-
Timeframes (4): M1, M5, M15, H1
-
EMA pairs: Short EMA 5–216, Long EMA 5–216 (short < long constraint) → 23,655 valid pairs
-
TP: 5–200 pips (step 5, 40 values)
-
SL: 5–200 pips (step 5, 40 values)
-
Total simulations: 23,655 × 1,600 × 36 jobs = 1,362,528,000
-
Test period: 25 years (2000–2025)
-
Spreads: EURUSD 0.7 / USDJPY 0.9 / AUDUSD 1.0 / EURGBP 1.5 / EURJPY 1.2 / GBPJPY 2.0 / NZDUSD 1.5 / USDCAD 1.2 pips; XAUUSD 0.3 USD/oz
-
Hardware: Linux, 32 cores, 28 workers (4 reserved for system)
-
Total wall time: 27.6 minutes
The Core Parallelization
28 workers via multiprocessing.Pool. The critical memory problem: storing all (TP,SL) results for every EMA config would consume tens of GB per worker. Solution: store only the best-scoring (TP,SL) per EMA config — reducing peak memory to ~3.5 GB per worker.
Results by Currency Pair
25-Year Survival Rate Comparison
The following chart shows the 25-year survival rate by currency pair — the fraction of top-20 configurations that finished positive after 25 years.
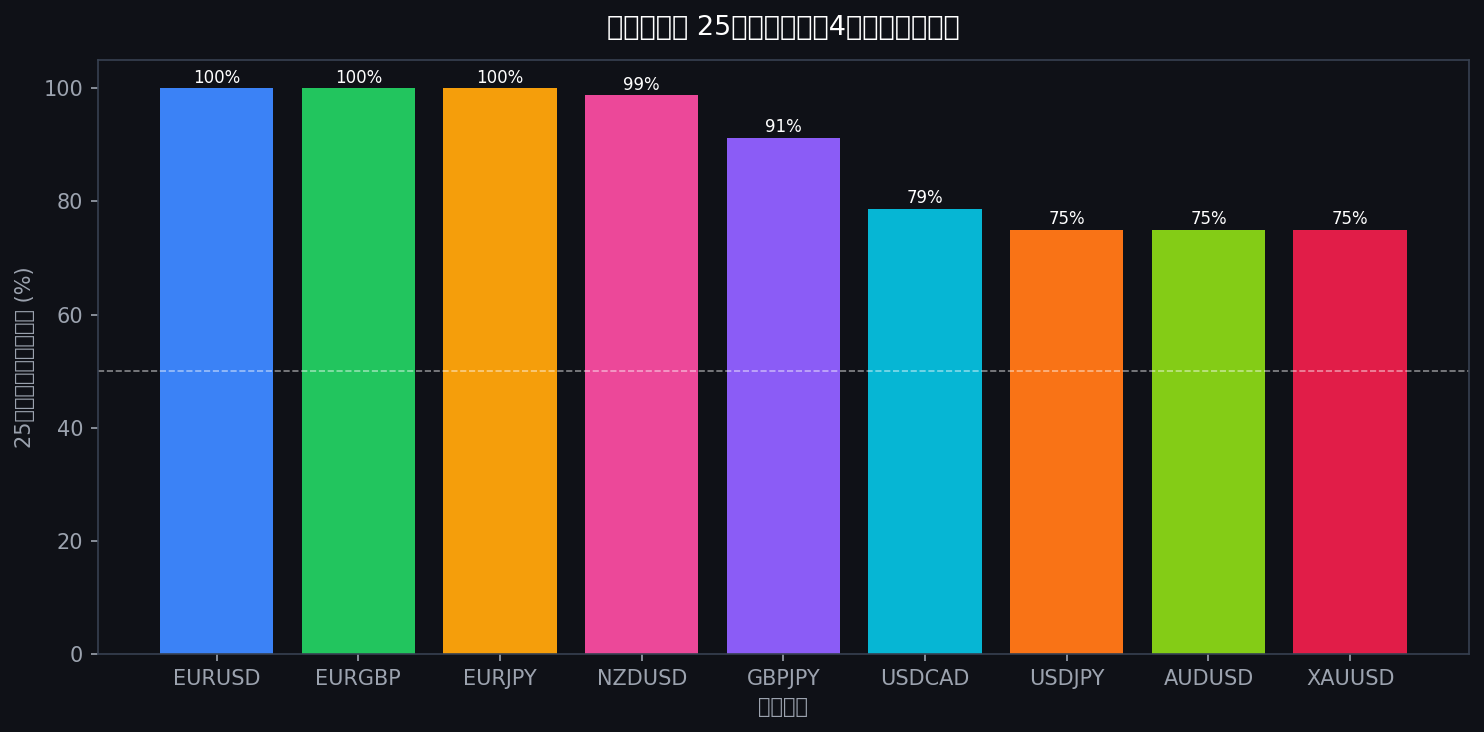
EMA cross effectiveness varies dramatically by currency pair.
| Pair | Best TF | Best Expectancy | 25Y Survival (of 20) |
|---|---|---|---|
| EURGBP | M15 | 92.010 pips | 20/20 |
| AUDUSD | M5 | 104.632 pips | 20/20 |
| EURUSD | M1 | 109.492 pips | 20/20 |
| NZDUSD | M5 | 97.733 pips | 20/20 |
| EURJPY | H1 | 37.247 pips | 20/20 |
| GBPJPY | H1 | 42.333 pips | 20/20 |
| USDJPY | M5 | 50.174 pips | 20/20 |
| USDCAD | M1 | 118.861 pips | 20/20 |
| XAUUSD | M15 | 17.421 pips | 0/20 |
The standout result: XAUUSD (Gold) behaves fundamentally differently. On M15, every single one of 20 top-scored configurations failed to survive 25 years. More on this below.
Best Expectancy Heatmap
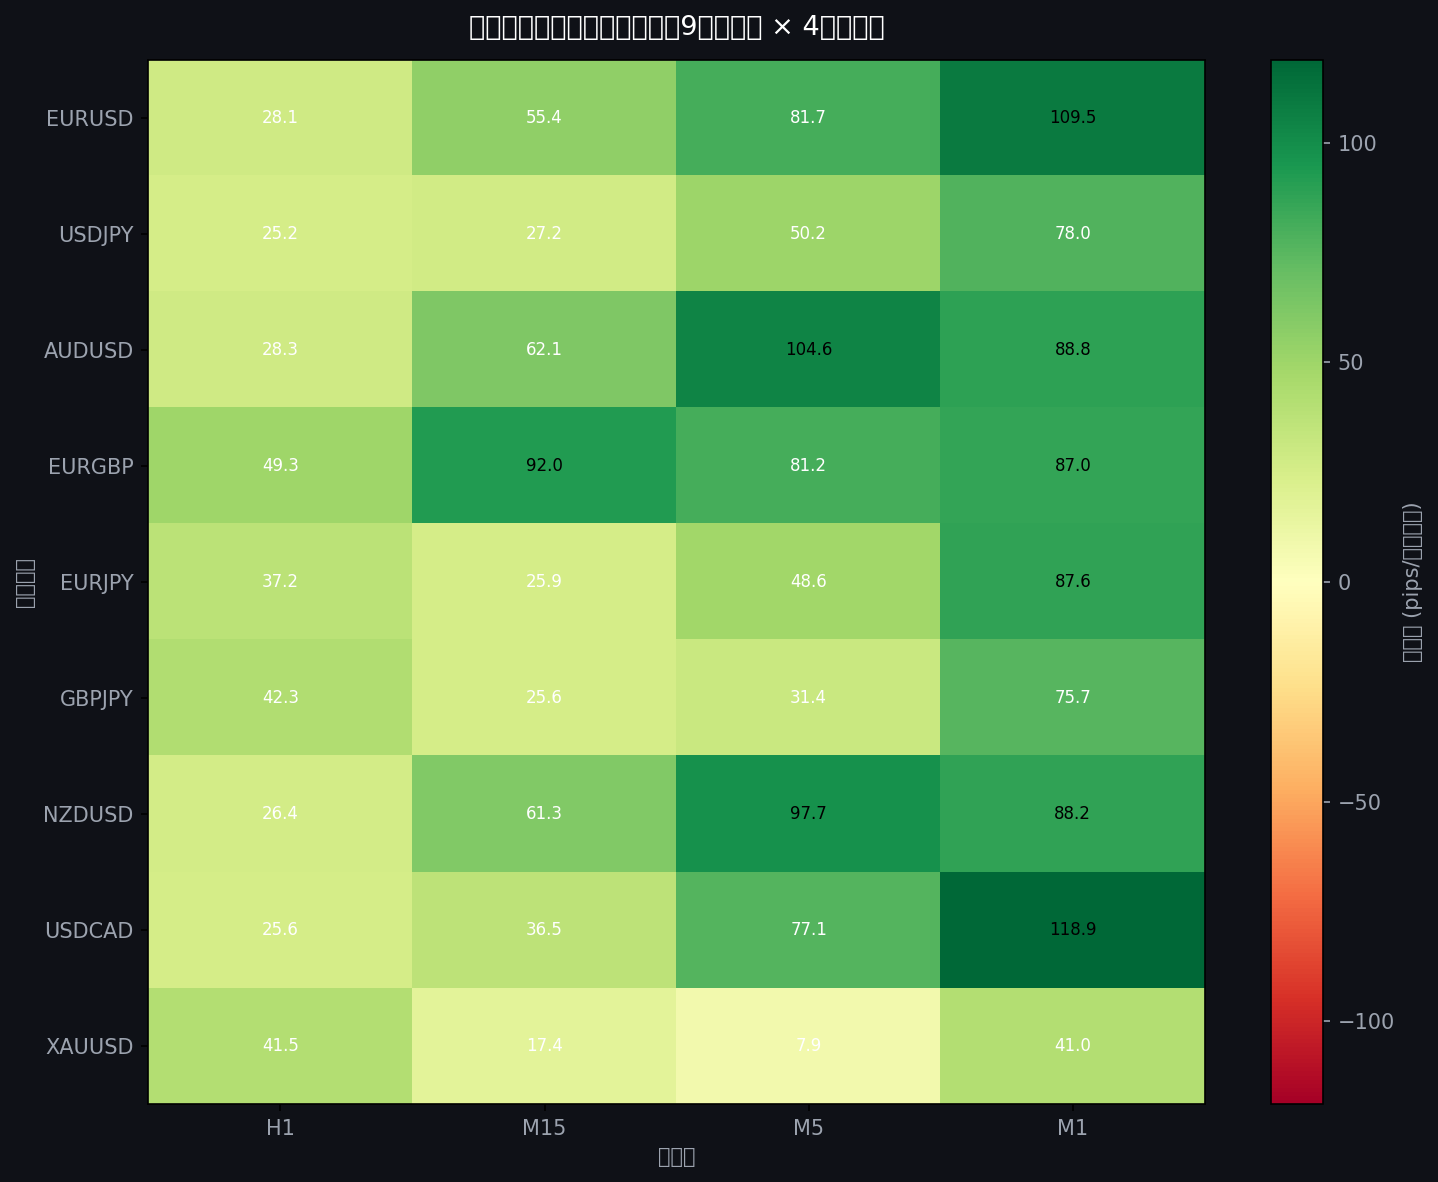
The key to reading this map is the distribution pattern. Pairs with wide green coverage (EURGBP, AUDUSD, NZDUSD) find positive expectancy across multiple timeframes — these are pairs where trends, once established, tend to persist. Pairs with yellow-to-red dominance (XAUUSD) suggest fundamental incompatibility with EMA crossover mechanics.
Results by Timeframe
What Changes Across Timeframes
| Timeframe | Avg Neg% | Notes |
|---|---|---|
| H1 | 67% | Large trends captured; spread cost ratio lowest |
| M15 | 62% | Balanced. Moderate whipsaws; captures intermediate trends |
| M5 | 61% | High frequency. Spread cost accumulates |
| M1 | ~0–52% | Highest frequency. Under optimal (TP,SL), nearly all EMA pairs find at least one profitable configuration |
A note on M1 showing neg=0% for most pairs.
This does not mean "all EMA configurations on M1 are profitable." It means: "of 23,655 EMA pairs, every single one had at least one (TP,SL) combination out of 1,600 that produced positive expectancy." M1 generates so many crossover signals that the optimal exit can almost always be found — but randomly chosen TP/SL settings will still lose. The number clarifies the shape of the solution space, not a general license to trade M1.
H1's 67% negative rate reflects fewer signals and more "no good (TP,SL) exists for this EMA pair" situations — not a spread cost problem, but a signal quality gap.
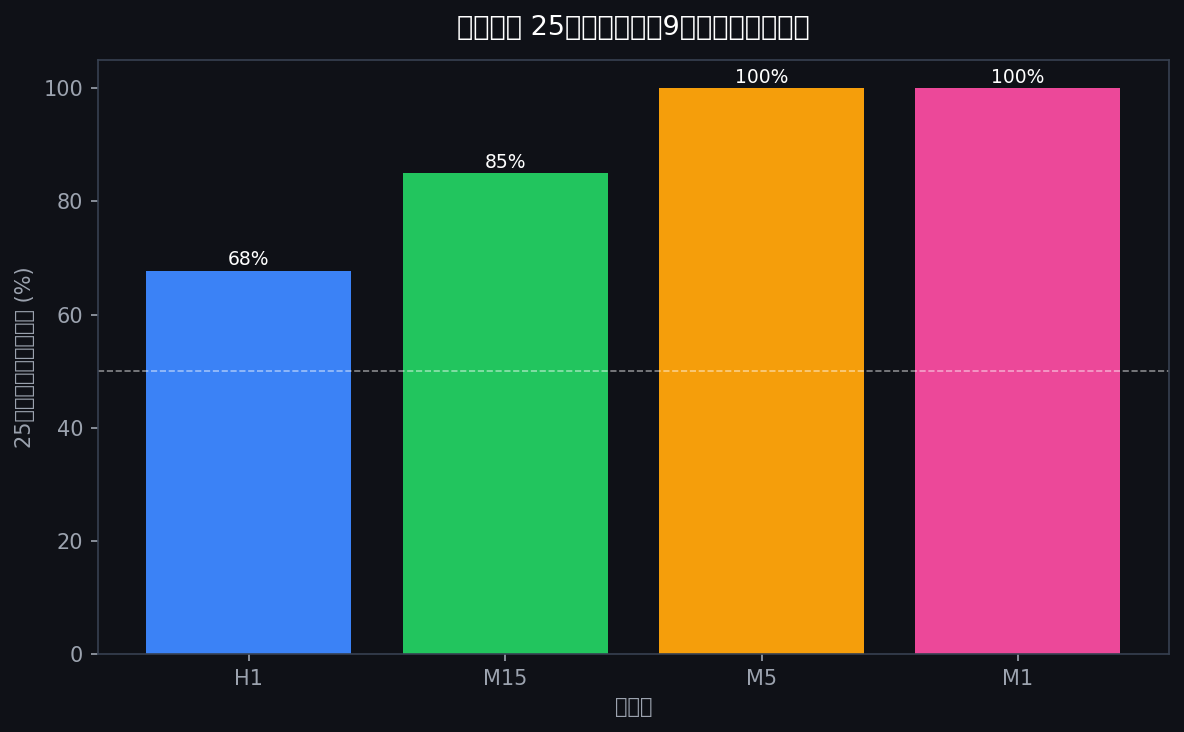
XAUUSD vs. FX Pairs
Does Gold Work With EMA Crosses?
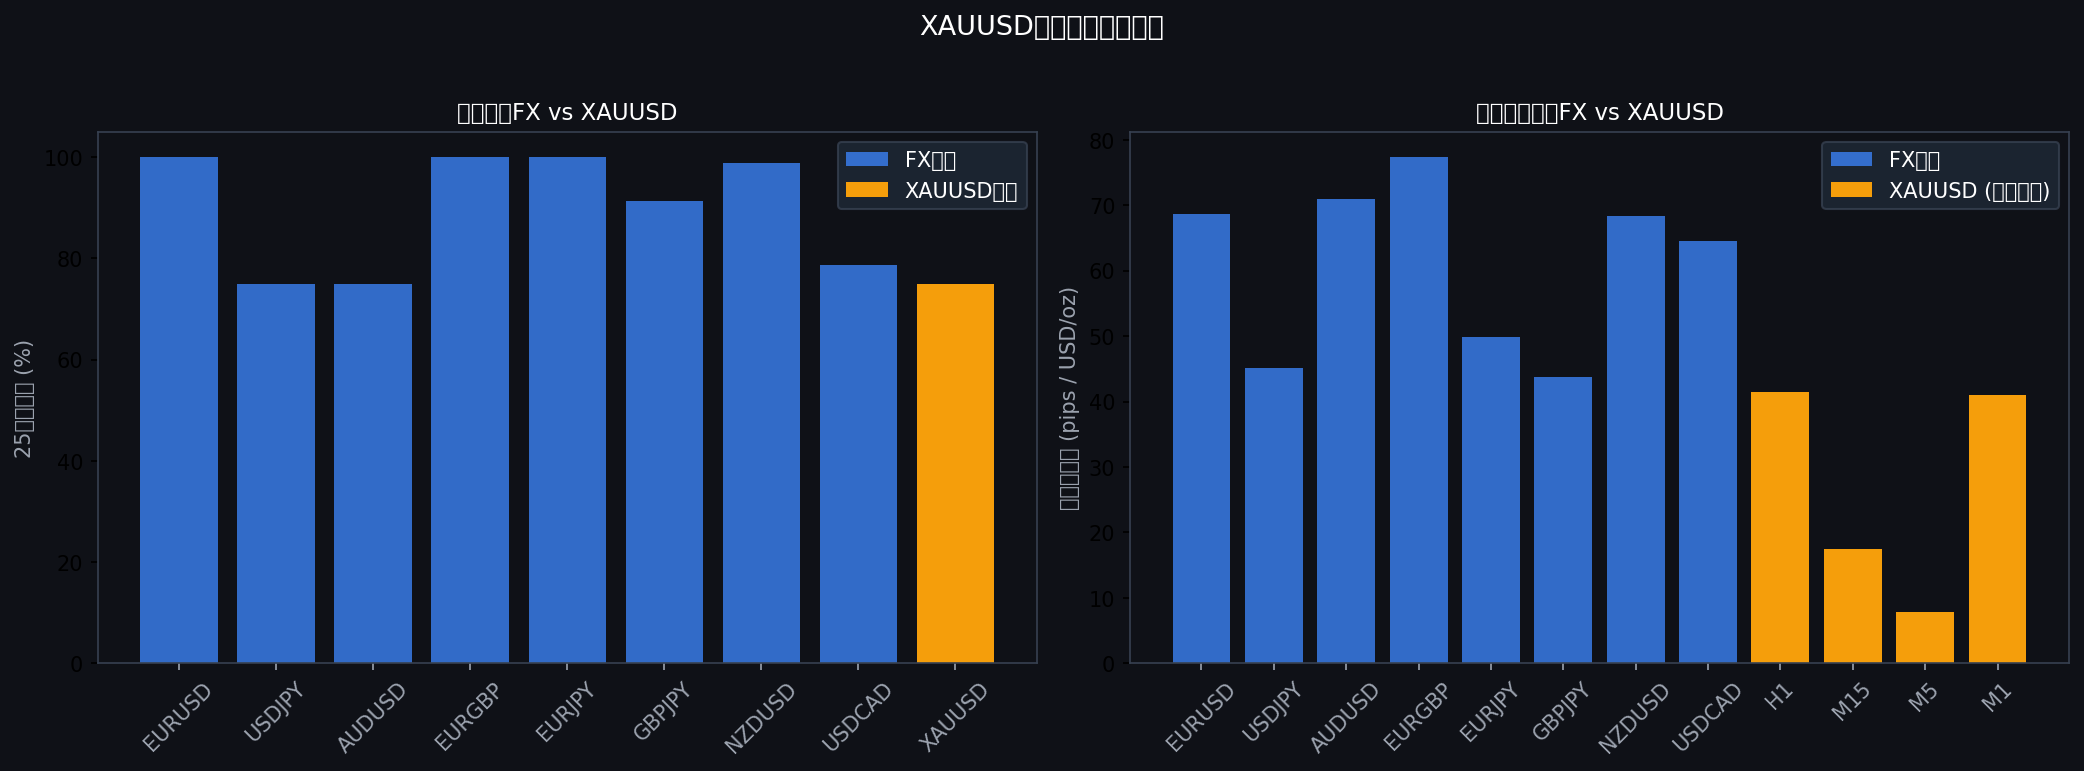
XAUUSD's results are strikingly distinct across timeframes.
| Timeframe | XAUUSD Result | vs. FX Average |
|---|---|---|
| H1 | best_exp=41.5, survival=20/20 | Comparable to FX |
| M15 | best_exp=17.4, survival=0/20 | FX pairs mostly 20/20; Gold: total wipeout |
| M5 | best_exp=7.9, survival=20/20 | Far below FX M5 average (60–100 pips) |
| M1 | best_exp=41.0, survival=20/20 | Roughly half of FX average |
The M15 total failure of XAUUSD is the most striking result in the entire study.
Gold (XAU/USD) differs from FX pairs in ways that directly impair EMA crossover mechanics.
-
It's priced in USD, so dollar index moves create double exposure. The reasons EURUSD moves 1 pip and XAUUSD moves 1 USD/oz are often entirely different factors.
-
Gold responds non-linearly to geopolitical risk and central bank policy. The COVID crash-and-recovery of 2020, the sustained decline under Fed rate hikes in 2022 — these generate rapid reversals that EMA crossovers can't trend-follow effectively.
-
The spread is tight (0.3 USD/oz) but volatility is large. This means both TP and SL get hit frequently, but directional persistence on M15 is low.
H1's 20/20 survival rate for XAUUSD is explained by longer timeframes giving gold's directional moves time to develop beyond the initial noise.
Best Pair × Timeframe Combinations
Top 3 Deep Dive
The script identified EURGBP, AUDUSD, and EURUSD as the top 3 pairs by composite score.
#1: EURGBP M15
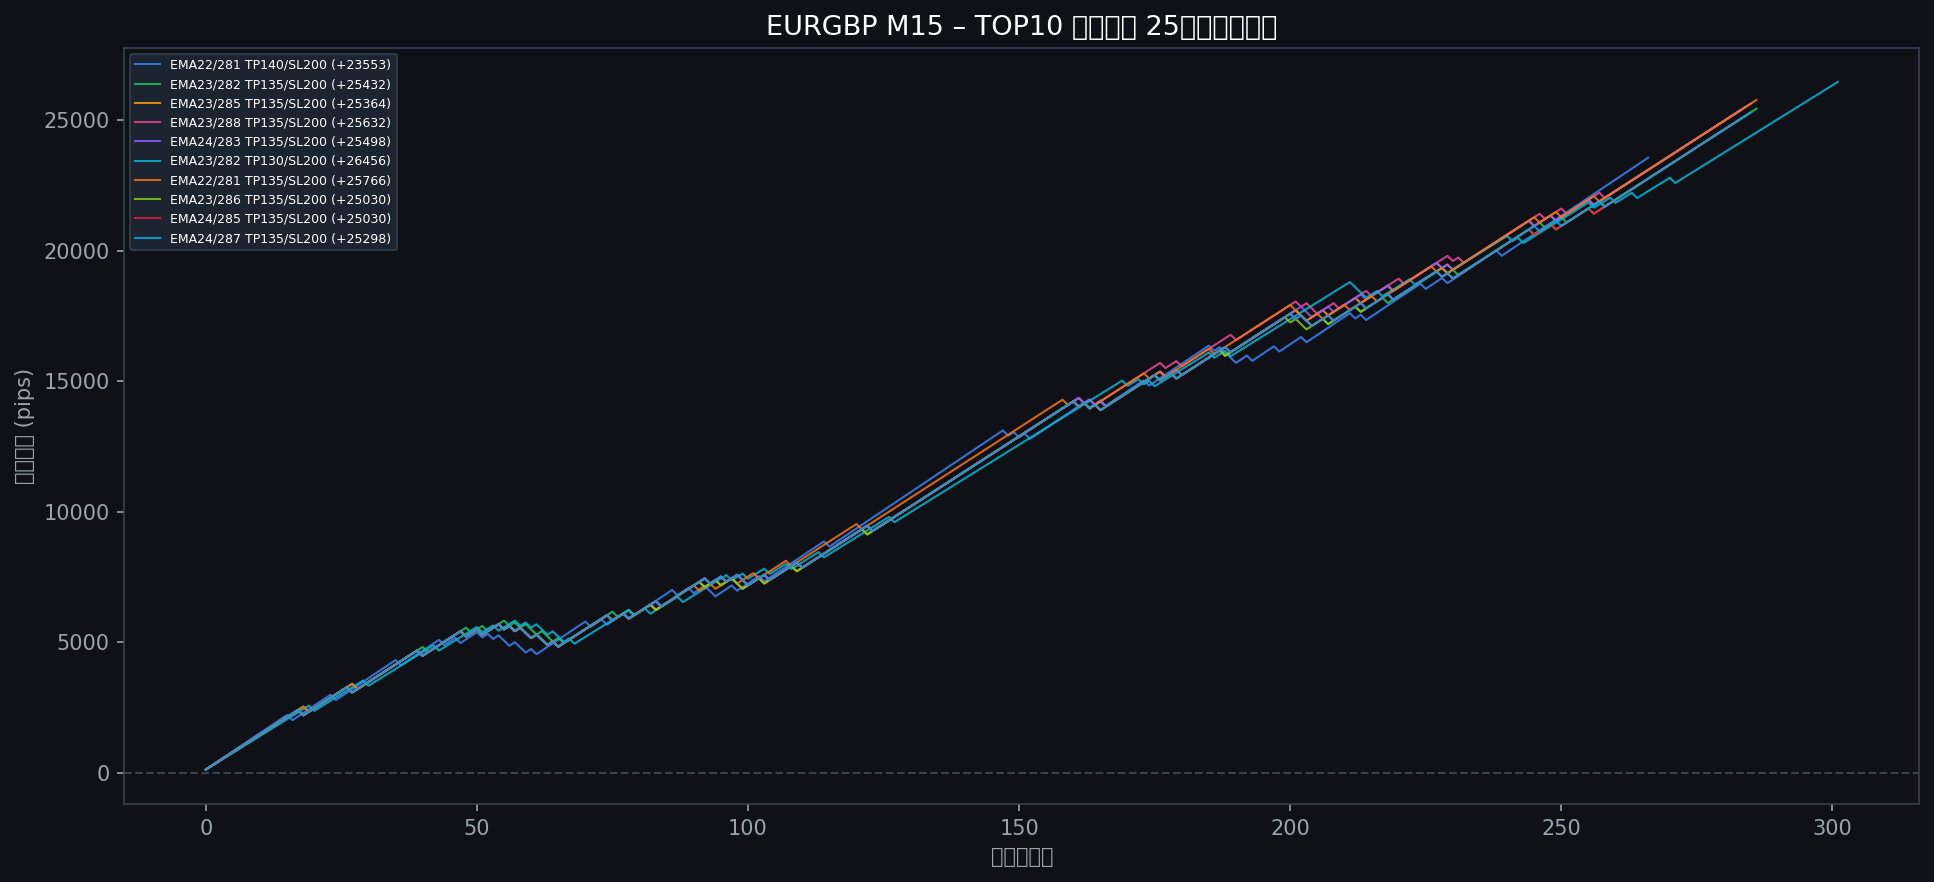
- Peak expectancy: 92.010 pips
- 25-year survival: 20/20 (100%)
- Negative expectancy rate: 57%
EURGBP is driven by the same fundamental forces on both sides (eurozone and UK economic data), meaning directional trends — when they occur — tend to be sustained. Brexit-related trends (2016–2020) were particularly favorable for EMA crossover mechanics on this pair.
#2: AUDUSD M5
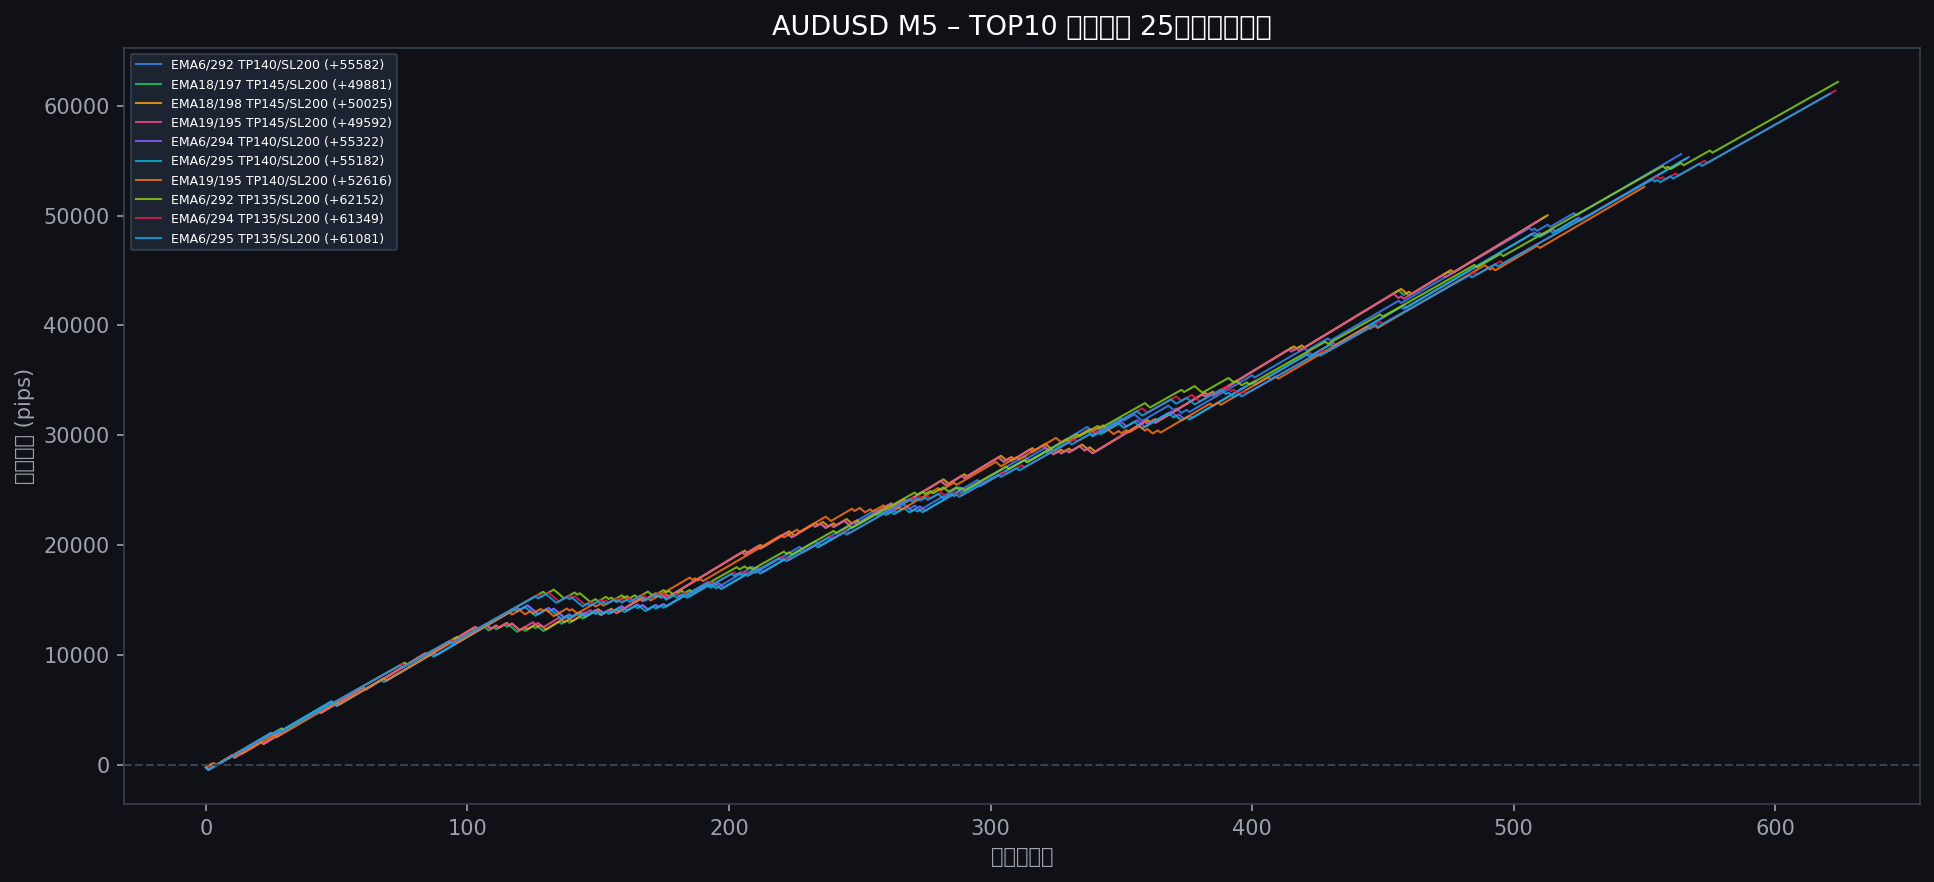
- Peak expectancy: 104.632 pips
- 25-year survival: 20/20 (100%)
- Negative expectancy rate: 55%
AUDUSD's high correlation with Chinese economic sentiment produces clear risk-on/risk-off directional moves. At M5, these intermediate trends are captured efficiently by EMA crossovers before the signal degrades.
#3: EURUSD M1
- Peak expectancy: 109.492 pips
- 25-year survival: 20/20 (100%)
- Negative expectancy rate: 52%
EURUSD M1 at peak expectancy 109 pips is a consequence of TP/SL optimization across a very high signal count — not a license to trade M1 blindly. EURUSD's world-leading liquidity and 0.7-pip spread give it a structural advantage at high frequencies where spread cost is the primary drag.
Phase 2 vs. Phase 1: What the Expansion Revealed
The Numbers Changed — Here's Why
| Item | Phase 1 (EURUSD M15) | Phase 2 (9 pairs × 4 TF) |
|---|---|---|
| EMA pairs | 7,830 | 23,655 |
| TP/SL range | 5–100 pips (20×20) | 5–200 pips (40×40) |
| Total evaluations | 3,132,000 | 1,362,528,000 |
| Processing time | Sequential, hours | 27.6 min (28-core parallel) |
| EURUSD M15 neg% | 94.2% | 66% |
Why does EURUSD M15's "negative %" differ between Phase 1 and Phase 2?
Phase 1 measured the distribution across all (EMA, TP, SL) combinations: 94.2% of those 3.1M combinations had negative expectancy.
Phase 2 stores only the best (TP, SL) per EMA config and asks: of these 23,655 best-of-1600 results, how many are negative? The 66% figure answers that question. The Phase 1 finding — 94.2% of arbitrary settings fail — remains true. The Phase 2 figure shows that when you optimize exit conditions per EMA config, 34% of configs have a profitable setting hiding somewhere in the TP/SL space.
Both numbers are correct; they measure different things.
What Phase 2 Revealed That Phase 1 Couldn't
-
Some pairs are structurally better for EMA crossovers. EURGBP and AUDUSD outperform EURUSD M15 on both expectancy and consistency. Fixing on EURUSD misses this.
-
Optimal timeframe is pair-dependent. EURUSD peaks at M1, EURGBP at M15, AUDUSD at M5. "M15 is the best timeframe" is not a general truth.
-
XAUUSD requires separate treatment. M15 total failure vs. H1 full survival — gold behaves like a different asset class for EMA cross purposes.
-
The structural edge in MA cross is real, not EURUSD-specific. Across 36 pair/TF combinations (excluding XAUUSD M5 and M15), optimized EMA settings achieved 25-year survival in nearly every case. No other indicator studied shows this pattern.
Conclusion
The 1.36 billion combination study across 9 pairs and 4 timeframes produces a clear verdict.
- EMA cross is not a universal magic formula — but unlike Bollinger Bands and RSI, it shows a genuine structural edge under specific conditions that survives 25 years
- Top combinations: EURGBP M15, AUDUSD M5, EURUSD M1 — all with ~55–57% negative rate and 100% 25-year survival
- XAUUSD M15: 0/20 survival — gold and FX pairs require fundamentally different treatment
- Textbook EMA(25,75) TP20/SL20: -4,467 pips over 25 years — unchanged across both studies
What the Golden Cross Actually Is
The Golden Cross is not a crystal ball. It's a momentum detector with a time lag.
It tells you, after the fact, that a trend may have started. It generates false signals constantly in ranging markets. But the data shows that Winton, Man AHL, and the CTAs who've compounded for decades are onto something real: when a genuine trend follows a crossover, the gains are large enough to compensate for many small losses — if the exit parameters are designed to capture them, and if the currency pair and timeframe are conducive to sustained trends.
Most retail traders fail at Golden Cross not because the concept is wrong, but because:
- SLs are too tight (whipsawed out before the trend develops)
- Profits are taken too early (missing the bulk of the move)
- The wrong pair/timeframe combination is chosen
- No distinction is made between trending and ranging environments
Use free backtesting tools to verify any strategy before deploying it. What this study found — through 1.36 billion simulations — is that the question is never "does Golden Cross work?" but "under precisely which conditions does it work, and can you execute those conditions consistently?"
That's what rigorous backtesting is for.
Open Source Research
The full Python scripts used in this backtest are publicly available on GitHub.