"MACD cross can win — you just need the right parameters."
If you still believe that, I won't mince words: stop reading this page and quit FX right now.
I slammed "2,000,000+ combinations" of MACD parameters against EURUSD data spanning 2000 to 2025 — 25 years of history. Hundreds of billions of calculations. After pushing computation to its physical limits, the conclusion is singular:
There is not a single shred of a "Holy Grail" in MACD cross strategies.
Thin maxims like "Buy the Golden Cross, sell the Death Cross" or "MACD shows market turning points" have been reduced to pathetic rubble before the weight of 25 years and the judgment of statistics.
In this article, I will expose the MACD results that I burned out my CPU to uncover.
The Scope of This Study
In this study, we investigate whether the MACD cross strategy actually wins over the long term.
The method is Brute Force Verification.
Simply put: Long on MACD Golden Cross (MACD line crosses above Signal line), Short on Death Cross (MACD line crosses below Signal line), exit at specified TP and SL pips.
Incredibly simple — yet this is the most fundamental approach, the same philosophy used by hedge funds to generate profits.
"We look for anomalies — edges in the data — and exploit them." — Jim Simons (Renaissance Technologies founder), TED Interview
"Investing is a scientific process — continuously testing thousands of hypotheses through rigorous data analysis." — Two Sigma (The Innovation Equation)
First: Testing the Common Settings
Let's start by seeing how the backtest actually works, using Delver, a free backtesting tool.
Test Conditions
-
Instrument / Timeframe: EURUSD M15
-
Spread: 0.7 pips
-
Slippage and swap: Disabled
-
Leverage: 25x
-
Risk management: Fixed lot (testing the strategy, not position sizing)
MACD Settings
The most widely known standard MACD configuration: Fast EMA 12, Slow EMA 26, Signal 9.
Long on Golden Cross (MACD line crosses above Signal line), Short on Death Cross (MACD line crosses below Signal line). TP and SL both fixed at 20 pips (RR 1:1).
Results
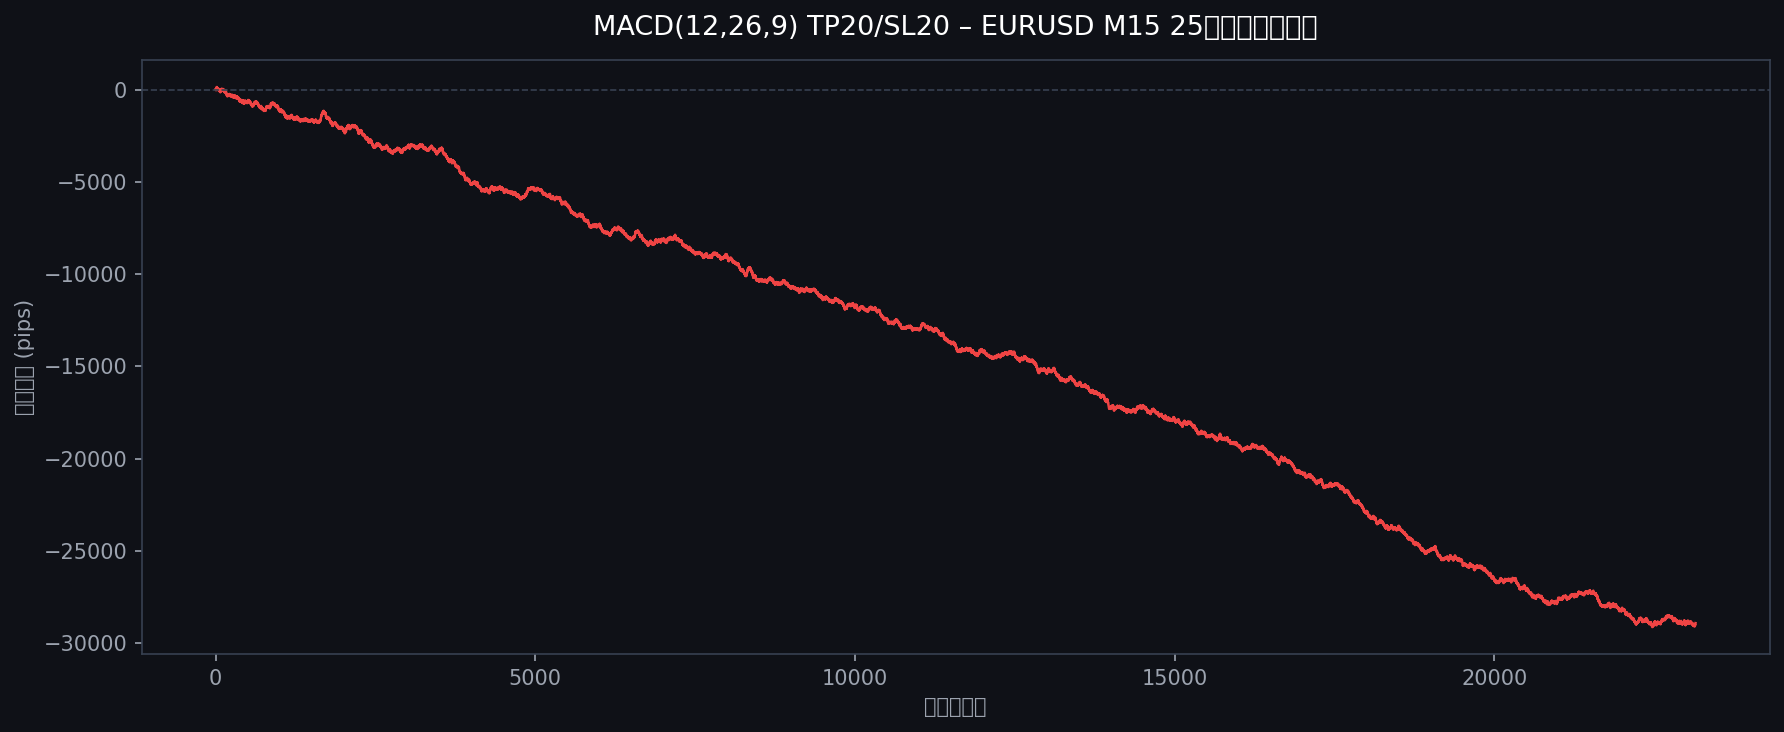
A catastrophic result — complete ruin.
-
25-year cumulative PnL: -28,912 pips — After 23,149 trades, the account is obliterated.
-
Consistent downtrend: From 2000 to 2025, assets erode in an almost straight line. Not a single sign of recovery.
-
The brutal math of spread costs: 23,000+ entries at 0.7 pips round-trip equals over 16,000 pips consumed by spread alone.
This is just one data point, however. Jumping to conclusions here would be a mistake. Maybe the exit conditions were the problem — that's the next hypothesis.
The Exit Condition Hypothesis
The previous test locked TP and SL at 20 pips (RR 1:1). But what if that was the problem?
MACD is a trend-following indicator — shouldn't we let profits run far and keep losses tight?
Or maybe short-term scalping-style exits are better suited for M15?
Countless hypotheses emerge. Let's test them all at once.
Brute Force Testing with Python
While Delver could handle this, 2 million+ combinations require Python for efficiency.
Full Test Scope
-
Entry logic: Long on MACD Golden Cross, Short on Death Cross
-
MACD parameters: Fast EMA 5–20, Slow EMA 20–50, Signal 5–15 (2,178,000 combinations total)
-
Take Profit (TP): 5–100 pips (step 5, 20 values)
-
Stop Loss (SL): 5–100 pips (step 5, 20 values)
-
Test period: 5 years (EURUSD M15, 2020–2025) → top candidates forwarded to 25-year endurance test
-
Total simulations: 2,178,000 MACD configs × 400 TP/SL combinations
-
Spread and costs: Same conditions as above (0.7 pips)
This setup answers every question: what if we try fast=8/slow=21/signal=6 instead of 12/26/9? Which TP/SL combination works best at 5-pip granularity? All of it, quantified.
Results
The results were striking.
Expectancy Distribution
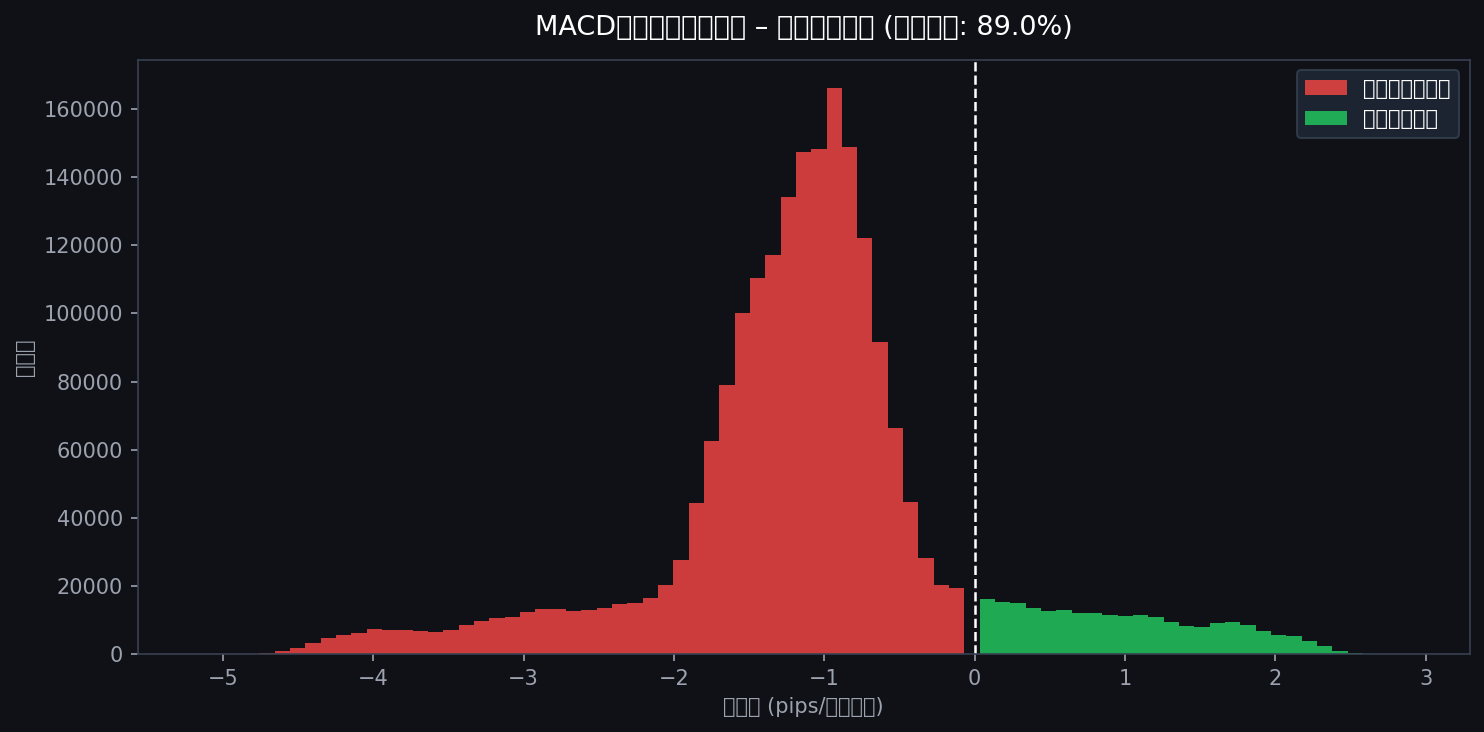
Most expectancy values are negative — but a small number turn positive, which is promising.
89.0% have negative expectancy. Only 11.0% show a positive edge.
TP × SL Expectancy Heatmap
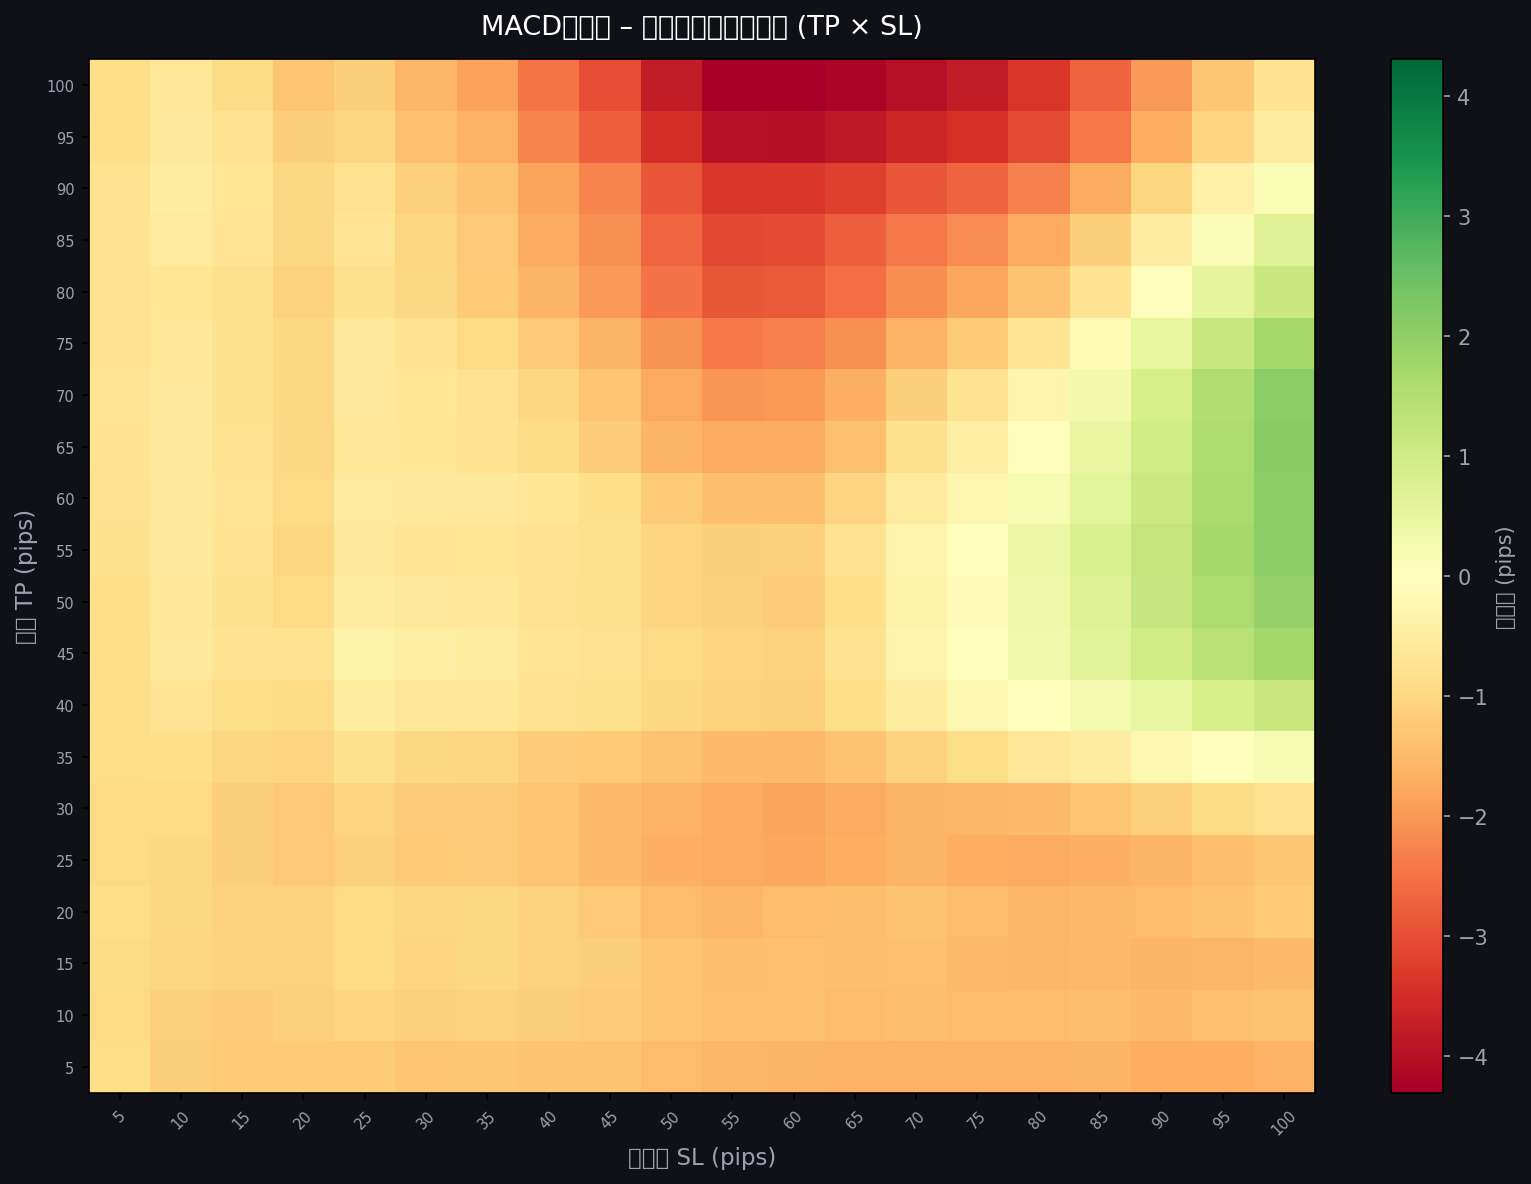
This heatmap shows the relationship between TP, SL, and expectancy.
As you can see, the vast majority of the map is dyed in the blue-to-purple of death.
Yet there are spots glowing yellow with positive expectancy.
In the area where TP extends to 65–100 pips and SL is set near 100 pips, a faint light of hope appears.
The hypothesis crystallizes: MACD may work better with a large TP and large SL style rather than tight scalping — catch the big moves, endure the big losses.
But don't be deceived here.
As an engineer, I subjected this "golden area" to two more ruthless tests to determine whether it was real.
Drawdown Heatmap
Drawdown is one of the most critical factors in any backtest.
Even with a high win rate, the curse of drawdown can destroy an account — I know this from experience.
Look at the heatmap below.
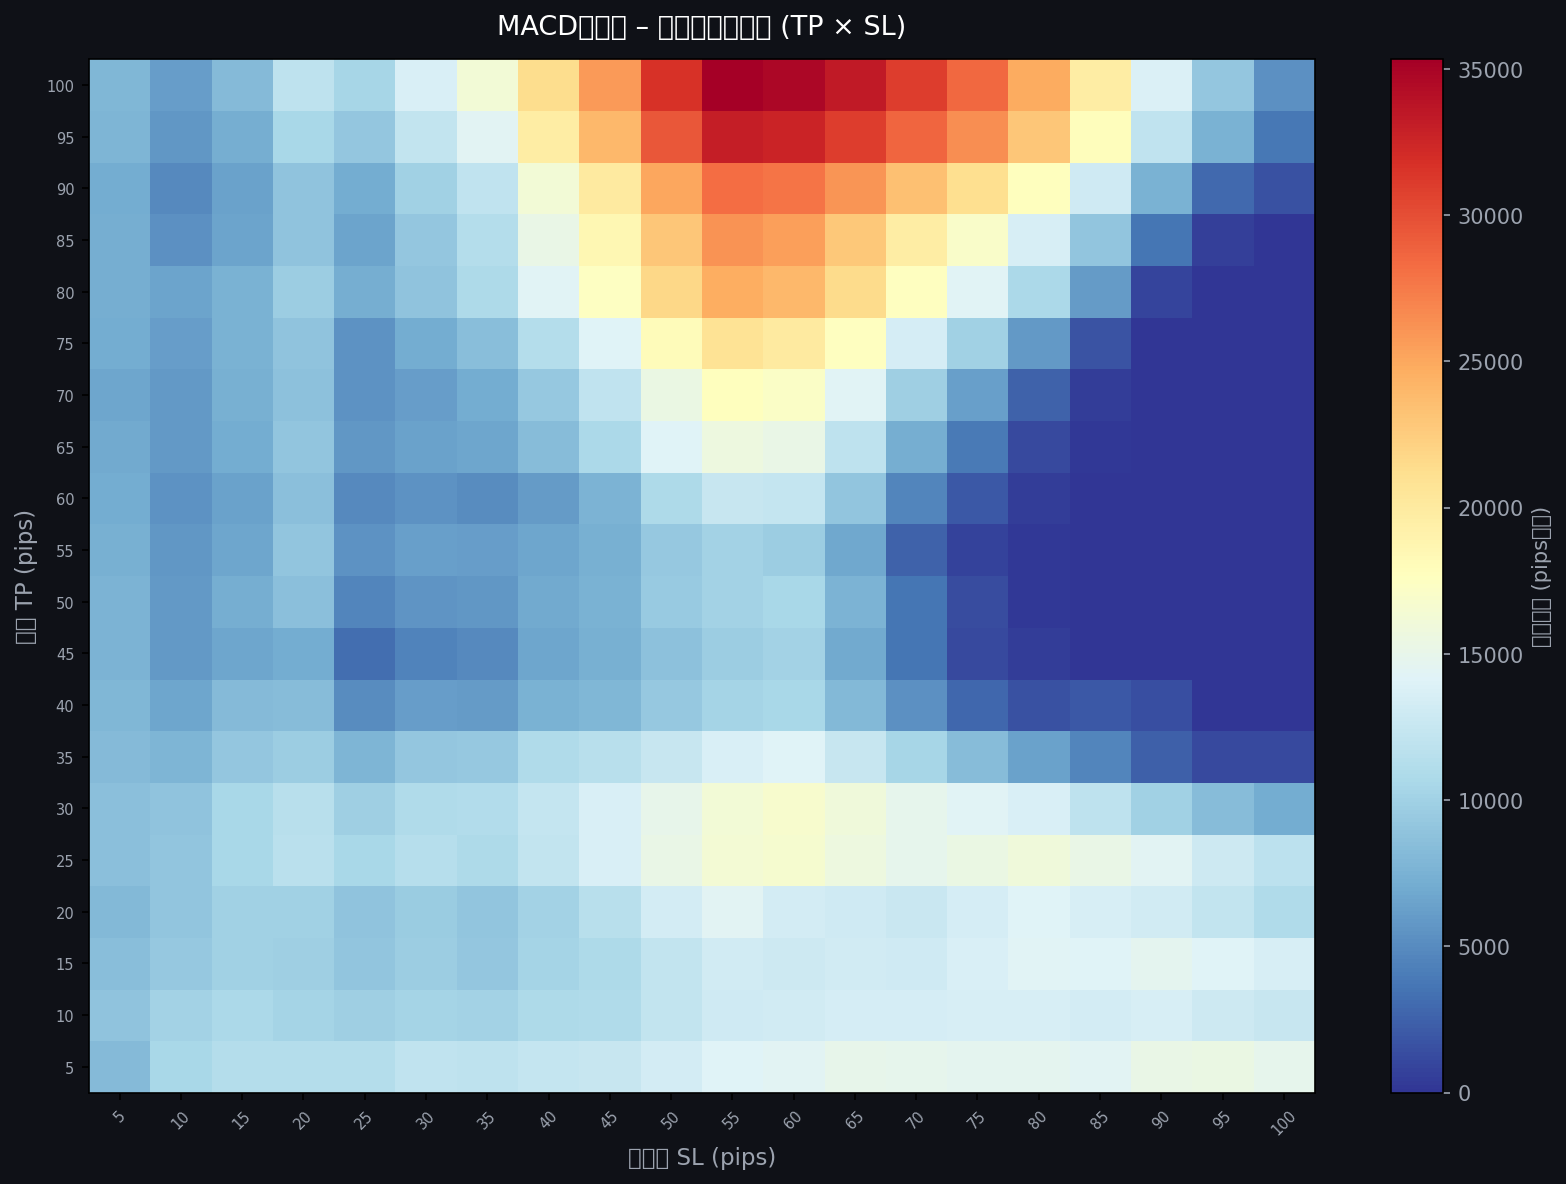
Reading this map is simple:
-
Yellow areas: Extremely large drawdown — "Dead Zones"
-
Blue areas: Drawdown kept low — "Safe Zones"
Now look again at the expectancy heatmap above.
In the bottom-right area — where TP was 65–100 and SL was 80–100 — can you spot the blue spots where drawdown is suppressed?
"Expectancy maximized, drawdown minimized."
After the madness of 2 million combinations, I had seemingly found the mathematically validated "True Holy Grail."
With trembling hands, I threw these "golden settings" into the most brutal test of all: 25 years.
Testing Elite Conditions Over 25 Years
From the 5-year results, MACD appeared to hold genuine promise. But does trading the high-expectancy, low-DD conditions actually produce profits over 25 years?
Defining Elite Conditions
As explained above, we extract the overlap of "green zones" in both heatmaps, with precise definitions:
Trade count filter
df = df[df["trades"] >= MIN_TRADES_5Y]
Only configurations with 200+ trades over 5 years. This eliminates lucky curve-fitted outliers and ensures statistical stability.
Maximum DD filter
df = df[df["max_dd"] <= MAX_DD_PIPS_5Y]
Only configurations with max DD ≤ 5,000 pips over 5 years. Eliminates strategies that are financially ruinous in practice.
Normalize DD by trade count
dd_per_trade = df["max_dd"] / df["trades"]
Strategies with more trades naturally accumulate more DD due to spread. This normalization removes frequency bias, keeping focus on the core question: does MACD work?
Score formula
score = expectancy − 0.30 × (max DD / trade count)
Expectancy is the primary metric; high-DD strategies are penalized. Strategies with lower DD and equal expectancy rank higher.
The top-scoring candidates:
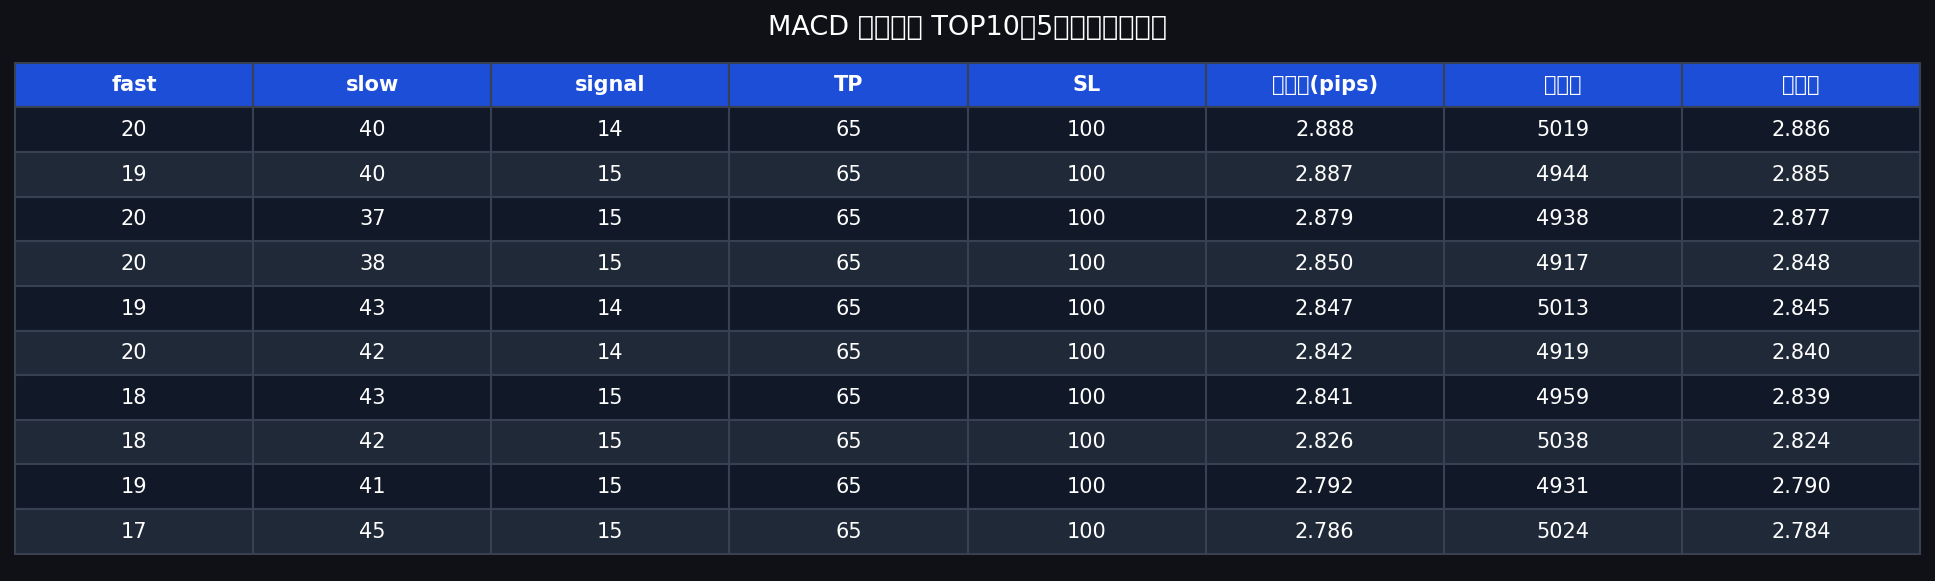
Elite Condition Results
Let the graph speak first.
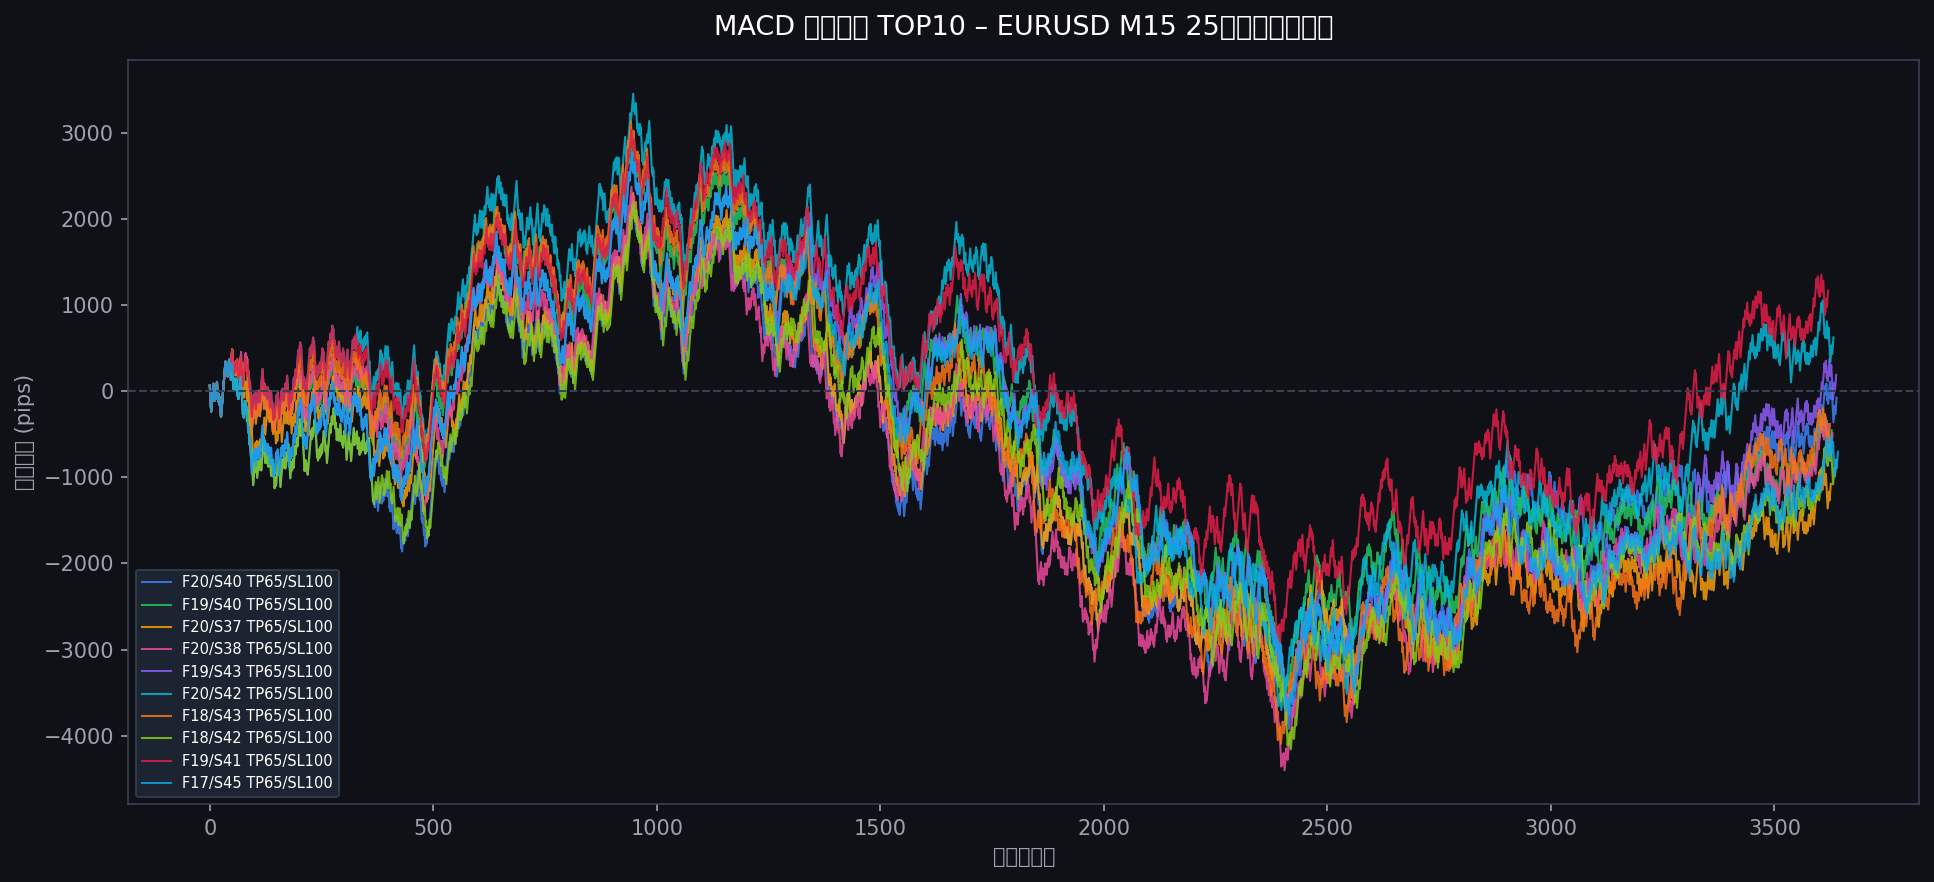
The vertical axis is PnL (profit and loss); the horizontal axis is trade count.
The conclusion requires no explanation: nearly all results are negative — essentially total annihilation.
A handful of configurations show +189, +625, and +1,167 pips, but across a 25-year timeframe, these are effectively zero.
However, declaring MACD useless based on this alone would be premature. Let's analyze.
Why Do Elite Conditions Turn Negative?
This graph exposes the fundamental truth of trading and backtesting.
Spread Cost Accumulation
Over 5 years, the 0.7-pip round-trip spread was manageable. But over 25 years, accumulated spread costs become catastrophic.
With TP65 and SL100, each trade carries a 1.4-pip cost — roughly 2% of the TP target as an immediate handicap. Multiplied across thousands of trades, even the best configurations are inevitably eroded.
It Was Just Luck
Five years seems sufficient, but seen from a 25-year perspective, it's only one chapter.
However, I consider this the more productive framing:
MACD had a genuine edge during the 2020–2025 period.
The market conditions post-2020 — the violent swings of COVID, the sustained trends following the Ukraine war — may have specifically favored MACD's trend-following characteristics.
This is the most valuable finding from this study.
Conclusion
Key findings from this study:
-
MACD functions only in very specific market conditions
-
Trading MACD alone causes expectancy to converge negative over the long term
-
The cumulative effect of spread costs becomes fatal over long periods
-
89% of TP/SL combinations have negative expectancy — MACD is not an indicator you can "tune to win"
The same conclusion emerged from our 25-year Bollinger Band study. Most technical indicators share this fate when used in isolation: long-term convergence to negative expectancy.
MACD Is Not a Useless Indicator
This study found positive-expectancy conditions in a specific time period.
Even if 89% of configurations are negative, concluding that MACD is worthless is too hasty.
The fact remains, however, that trading MACD continuously as a standalone strategy will erode capital — the structure of the market ensures it.
Find the Edge — Don't Just Execute the Signal
The most important lesson from this study:
Backtesting exists to find edges, not to find magic settings.
We identified a period where MACD had a genuine edge. The next step is to extract that edge through filtering:
- Use MACD only in trending markets (filter with ADX or moving averages)
- Filter by day of week
- Move to longer timeframes (MACD cross on daily or 4H charts)
- Add price action confirmation
This work is endless — and that's exactly the point. None of it requires Python.
Free backtesting tools can handle much of this work. Delver, used in this study, is particularly well-suited for brute-force parameter sweeps — but choose the tool that best fits your trading philosophy.
Open Source Research
In the interest of transparency and reproducibility, the full Python scripts used in this backtest are publicly available on GitHub. Everything from data processing logic to statistical computation is open for review.